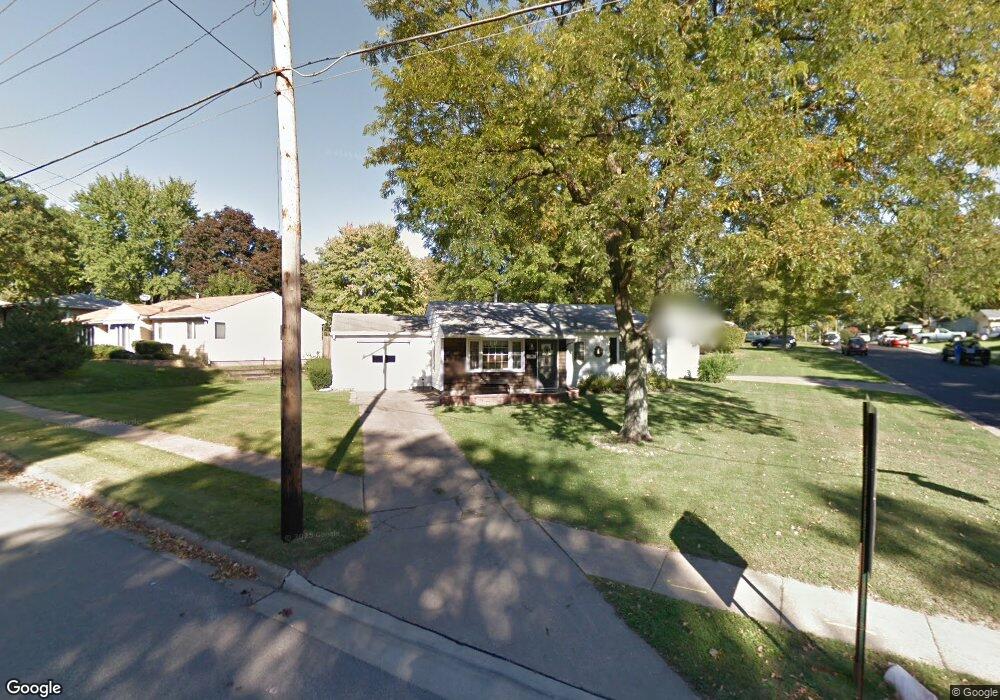
1107 14th St Bettendorf, IA 52722
Downtown Bettendorf NeighborhoodEstimated Value: $147,000 - $169,000
3
Beds
1
Bath
852
Sq Ft
$191/Sq Ft
Est. Value
About This Home
This home is located at 1107 14th St, Bettendorf, IA 52722 and is currently estimated at $162,381, approximately $190 per square foot. 1107 14th St is a home located in Scott County with nearby schools including Mark Twain Elementary School, Bettendorf Middle School, and Bettendorf High School.
Ownership History
Date
Name
Owned For
Owner Type
Purchase Details
Closed on
Mar 5, 2013
Sold by
Leonard Roy J and Leonard Marilee K
Bought by
Leonard James Roy
Current Estimated Value
Home Financials for this Owner
Home Financials are based on the most recent Mortgage that was taken out on this home.
Original Mortgage
$63,000
Outstanding Balance
$12,499
Interest Rate
3.49%
Mortgage Type
New Conventional
Estimated Equity
$149,882
Purchase Details
Closed on
Feb 28, 2013
Sold by
Leonard Roy J
Bought by
Leonard James Roy
Home Financials for this Owner
Home Financials are based on the most recent Mortgage that was taken out on this home.
Original Mortgage
$63,000
Outstanding Balance
$12,499
Interest Rate
3.49%
Mortgage Type
New Conventional
Estimated Equity
$149,882
Purchase Details
Closed on
Aug 5, 2010
Sold by
Leonard Eber J and Leonard Ruth A
Bought by
Leonard Eber J and Leonard Roy J
Create a Home Valuation Report for This Property
The Home Valuation Report is an in-depth analysis detailing your home's value as well as a comparison with similar homes in the area
Home Values in the Area
Average Home Value in this Area
Purchase History
| Date | Buyer | Sale Price | Title Company |
|---|---|---|---|
| Leonard James Roy | -- | None Available | |
| Leonard James Roy | $70,000 | None Available | |
| Leonard Eber J | -- | None Available |
Source: Public Records
Mortgage History
| Date | Status | Borrower | Loan Amount |
|---|---|---|---|
| Open | Leonard James Roy | $63,000 |
Source: Public Records
Tax History Compared to Growth
Tax History
| Year | Tax Paid | Tax Assessment Tax Assessment Total Assessment is a certain percentage of the fair market value that is determined by local assessors to be the total taxable value of land and additions on the property. | Land | Improvement |
|---|---|---|---|---|
| 2025 | $2,254 | $171,900 | $44,100 | $127,800 |
| 2024 | $2,236 | $145,700 | $28,800 | $116,900 |
| 2023 | $2,106 | $145,700 | $28,800 | $116,900 |
| 2022 | $2,084 | $119,600 | $28,780 | $90,820 |
| 2021 | $2,084 | $119,600 | $28,780 | $90,820 |
| 2020 | $1,800 | $102,710 | $28,780 | $73,930 |
| 2019 | $1,950 | $99,190 | $28,780 | $70,410 |
| 2018 | $1,852 | $99,190 | $28,780 | $70,410 |
| 2017 | $1,714 | $99,190 | $28,780 | $70,410 |
| 2016 | $1,674 | $89,760 | $0 | $0 |
| 2015 | $1,674 | $86,170 | $0 | $0 |
| 2014 | $1,628 | $86,170 | $0 | $0 |
| 2013 | $1,592 | $0 | $0 | $0 |
| 2012 | -- | $86,370 | $17,990 | $68,380 |
Source: Public Records
Map
Nearby Homes
- 1111 14th St
- 1410 Bellevue Ave
- 1403 Bellevue Ave
- 1115 14th St
- 1414 Bellevue Ave
- 1409 Bellevue Ave
- 1413 Bellevue Ave
- 1015 14th St
- 1417 Bellevue Ave
- 1112 15th St
- 1418 Bellevue Ave
- 1116 15th St
- 1116 14th St
- 1404 Central Ave
- 1205 14th St
- 1410 Central Ave
- 1414 Central Ave
- 1421 Bellevue Ave
- 1120 14th St
- 4323 Ontario Dr