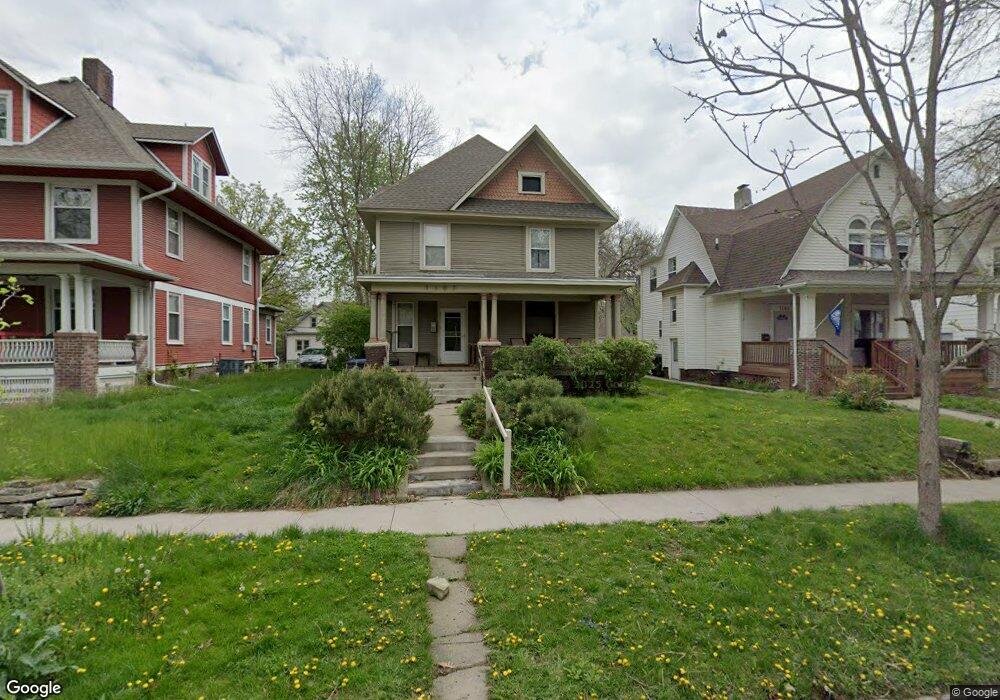
1107 26th St Des Moines, IA 50311
Drake NeighborhoodEstimated Value: $275,436 - $390,000
5
Beds
2
Baths
2,323
Sq Ft
$140/Sq Ft
Est. Value
About This Home
This home is located at 1107 26th St, Des Moines, IA 50311 and is currently estimated at $324,859, approximately $139 per square foot. 1107 26th St is a home located in Polk County with nearby schools including Hubbell Elementary and Roosevelt High School.
Ownership History
Date
Name
Owned For
Owner Type
Purchase Details
Closed on
Oct 27, 2025
Sold by
Lafrance Maria and Hostager Dan
Bought by
Crouch Seth
Current Estimated Value
Home Financials for this Owner
Home Financials are based on the most recent Mortgage that was taken out on this home.
Original Mortgage
$182,400
Outstanding Balance
$182,400
Interest Rate
6.26%
Mortgage Type
New Conventional
Estimated Equity
$142,459
Purchase Details
Closed on
Jan 8, 2010
Sold by
Mooring Tax Asset Group Xliv Llc
Bought by
Lafrance Maria
Purchase Details
Closed on
Aug 31, 2009
Sold by
Maloney Mary
Bought by
Mooring Tax Asset Group Xliv Llc
Purchase Details
Closed on
Dec 4, 2003
Sold by
Meadow Vista Development Lc
Bought by
Midland Homes Lc
Create a Home Valuation Report for This Property
The Home Valuation Report is an in-depth analysis detailing your home's value as well as a comparison with similar homes in the area
Home Values in the Area
Average Home Value in this Area
Purchase History
| Date | Buyer | Sale Price | Title Company |
|---|---|---|---|
| Crouch Seth | $228,000 | None Listed On Document | |
| Lafrance Maria | $25,000 | Itc | |
| Mooring Tax Asset Group Xliv Llc | $1,500 | None Available | |
| Midland Homes Lc | -- | -- |
Source: Public Records
Mortgage History
| Date | Status | Borrower | Loan Amount |
|---|---|---|---|
| Open | Crouch Seth | $182,400 |
Source: Public Records
Tax History Compared to Growth
Tax History
| Year | Tax Paid | Tax Assessment Tax Assessment Total Assessment is a certain percentage of the fair market value that is determined by local assessors to be the total taxable value of land and additions on the property. | Land | Improvement |
|---|---|---|---|---|
| 2025 | $4,496 | $264,800 | $24,900 | $239,900 |
| 2024 | $4,496 | $228,500 | $21,400 | $207,100 |
| 2023 | $4,156 | $228,500 | $21,400 | $207,100 |
| 2022 | $4,124 | $176,300 | $17,300 | $159,000 |
| 2021 | $3,868 | $176,300 | $17,300 | $159,000 |
| 2020 | $4,018 | $155,000 | $15,300 | $139,700 |
| 2019 | $4,068 | $155,000 | $15,300 | $139,700 |
| 2018 | $4,028 | $151,400 | $11,700 | $139,700 |
| 2017 | $3,716 | $151,400 | $11,700 | $139,700 |
| 2016 | $3,620 | $137,400 | $10,500 | $126,900 |
| 2015 | $3,620 | $137,400 | $10,500 | $126,900 |
| 2014 | $3,470 | $130,600 | $10,000 | $120,600 |
Source: Public Records
Map
Nearby Homes