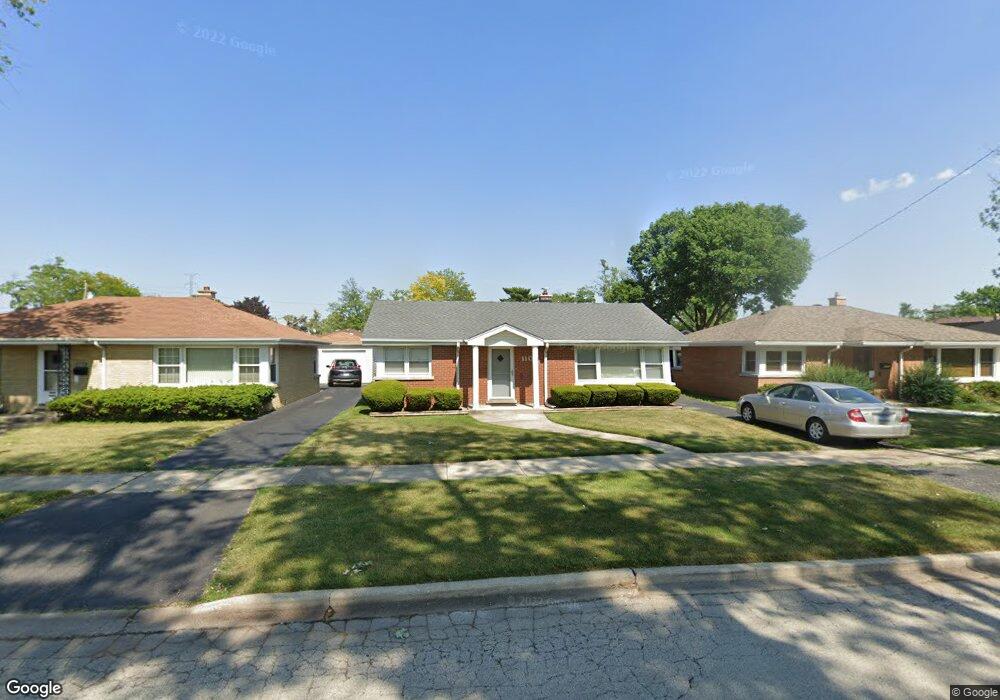
1107 Arthur Ave Berkeley, IL 60163
Estimated Value: $285,346 - $318,000
3
Beds
2
Baths
1,290
Sq Ft
$232/Sq Ft
Est. Value
About This Home
This home is located at 1107 Arthur Ave, Berkeley, IL 60163 and is currently estimated at $299,837, approximately $232 per square foot. 1107 Arthur Ave is a home located in Cook County with nearby schools including Macarthur Intermediate School, Sunnyside Elementary School, and Proviso West High School.
Ownership History
Date
Name
Owned For
Owner Type
Purchase Details
Closed on
Nov 14, 2005
Sold by
Gonzalez Edward J
Bought by
Meadows Lawanda and Meadows Derrick Keith
Current Estimated Value
Home Financials for this Owner
Home Financials are based on the most recent Mortgage that was taken out on this home.
Original Mortgage
$199,800
Outstanding Balance
$108,374
Interest Rate
6.17%
Mortgage Type
Fannie Mae Freddie Mac
Estimated Equity
$191,463
Purchase Details
Closed on
Aug 16, 2004
Sold by
Weber Agnes C
Bought by
Gonzalez Edward J
Home Financials for this Owner
Home Financials are based on the most recent Mortgage that was taken out on this home.
Original Mortgage
$162,000
Interest Rate
6.08%
Mortgage Type
Unknown
Purchase Details
Closed on
Sep 1, 1999
Sold by
Weber Agnes C
Bought by
Weber Agnes C and Agnes C Weber Trust
Create a Home Valuation Report for This Property
The Home Valuation Report is an in-depth analysis detailing your home's value as well as a comparison with similar homes in the area
Home Values in the Area
Average Home Value in this Area
Purchase History
| Date | Buyer | Sale Price | Title Company |
|---|---|---|---|
| Meadows Lawanda | $222,000 | Chicago Title Insurance Comp | |
| Gonzalez Edward J | $180,000 | Git | |
| Weber Agnes C | -- | -- |
Source: Public Records
Mortgage History
| Date | Status | Borrower | Loan Amount |
|---|---|---|---|
| Open | Meadows Lawanda | $199,800 | |
| Previous Owner | Gonzalez Edward J | $162,000 |
Source: Public Records
Tax History
| Year | Tax Paid | Tax Assessment Tax Assessment Total Assessment is a certain percentage of the fair market value that is determined by local assessors to be the total taxable value of land and additions on the property. | Land | Improvement |
|---|---|---|---|---|
| 2025 | $5,940 | $22,000 | $3,685 | $18,315 |
| 2024 | $5,940 | $22,000 | $3,685 | $18,315 |
| 2023 | $5,157 | $22,000 | $3,685 | $18,315 |
| 2022 | $5,157 | $17,896 | $3,183 | $14,713 |
| 2021 | $5,211 | $17,894 | $3,182 | $14,712 |
| 2020 | $5,084 | $17,894 | $3,182 | $14,712 |
| 2019 | $3,690 | $14,879 | $2,847 | $12,032 |
| 2018 | $3,613 | $14,879 | $2,847 | $12,032 |
| 2017 | $3,497 | $14,879 | $2,847 | $12,032 |
| 2016 | $3,659 | $13,319 | $2,512 | $10,807 |
| 2015 | $3,561 | $13,319 | $2,512 | $10,807 |
| 2014 | $3,533 | $13,319 | $2,512 | $10,807 |
| 2013 | $3,720 | $14,668 | $2,512 | $12,156 |
Source: Public Records
Map
Nearby Homes
- 5905 Superior St
- 5706 Saint Charles Rd
- 5700 Saint Charles Rd
- 1428 1/2 N Ashbel Ave
- 1447 N Ashbel Ave
- 124 S Fairlane Ave
- 1529 N Hillside Ave
- 444 E Schiller St
- 244 S Linden Ave
- 330 E Saint Charles Rd
- 4938 W Randolph St
- 4904 W Hawthorne Ave
- 515 S Parkview Ave
- 220 N Geneva Ave
- 238 N Geneva Ave
- 219 N Clinton Ave
- 175 N Berteau Ave
- 406 S Poplar Ave
- 377 S Prairie Ave
- 5949 School St
- 1103 Arthur Ave
- 1111 Arthur Ave
- 1051 Arthur Ave
- 1115 Arthur Ave
- 1106 Herbert Ave
- 1102 Herbert Ave
- 1110 Herbert Ave
- 1110 Herbert Ave
- 1047 Arthur Ave
- 1117 Arthur Ave
- 1050 Herbert Ave
- 1114 Herbert Ave
- 1106 Arthur Ave
- 1043 Arthur Ave
- 1046 Herbert Ave
- 1118 Herbert Ave
- 1102 Arthur Ave
- 1110 Arthur Ave
- 1050 Arthur Ave
- 1114 Arthur Ave
Your Personal Tour Guide
Ask me questions while you tour the home.