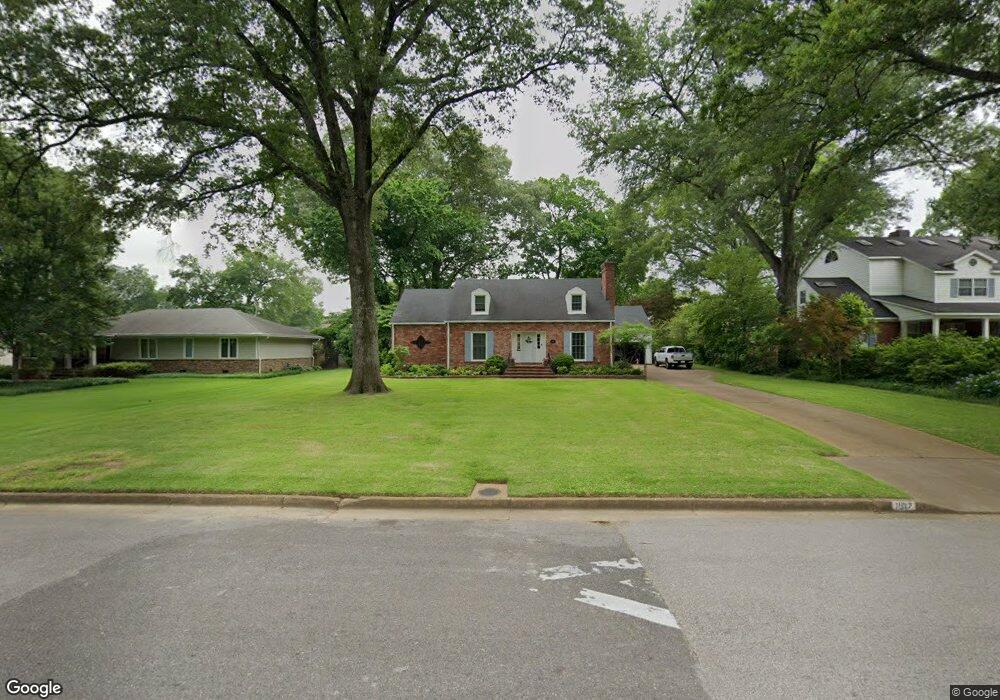
1107 Fairmeadow Rd Memphis, TN 38117
Colonial Acres NeighborhoodEstimated Value: $399,121 - $506,000
4
Beds
3
Baths
3,902
Sq Ft
$110/Sq Ft
Est. Value
About This Home
This home is located at 1107 Fairmeadow Rd, Memphis, TN 38117 and is currently estimated at $431,030, approximately $110 per square foot. 1107 Fairmeadow Rd is a home located in Shelby County with nearby schools including Sherwood Elementary School, Colonial Middle, and Overton High.
Ownership History
Date
Name
Owned For
Owner Type
Purchase Details
Closed on
Jan 11, 2020
Sold by
Rice Jared and Givens Rebecca
Bought by
Rice Jared B and Rice Rebecca G
Current Estimated Value
Home Financials for this Owner
Home Financials are based on the most recent Mortgage that was taken out on this home.
Original Mortgage
$231,000
Outstanding Balance
$155,589
Interest Rate
3.6%
Mortgage Type
New Conventional
Estimated Equity
$275,441
Purchase Details
Closed on
Jun 14, 2018
Sold by
Diaz Arlene S
Bought by
Givens Rebecca and Rice Jared
Home Financials for this Owner
Home Financials are based on the most recent Mortgage that was taken out on this home.
Original Mortgage
$240,800
Interest Rate
4.5%
Mortgage Type
New Conventional
Purchase Details
Closed on
May 29, 2010
Sold by
Diaz Ramon R and Diaz Arlene
Bought by
Diaz Ramon R
Purchase Details
Closed on
Jul 20, 2006
Sold by
Diaz Ramon R
Bought by
Diaz Arlene and Diaz Ramon R
Purchase Details
Closed on
May 30, 2001
Sold by
Diaz Ramon R
Bought by
Diaz Ramon R and Ramon R Diaz Living Trust
Create a Home Valuation Report for This Property
The Home Valuation Report is an in-depth analysis detailing your home's value as well as a comparison with similar homes in the area
Home Values in the Area
Average Home Value in this Area
Purchase History
| Date | Buyer | Sale Price | Title Company |
|---|---|---|---|
| Rice Jared B | -- | None Available | |
| Givens Rebecca | $301,000 | None Available | |
| Diaz Ramon R | -- | None Available | |
| Diaz Arlene | -- | None Available | |
| Diaz Arlene | -- | None Available | |
| Diaz Ramon R | -- | -- | |
| Diaz Ramon R | -- | -- |
Source: Public Records
Mortgage History
| Date | Status | Borrower | Loan Amount |
|---|---|---|---|
| Open | Rice Jared B | $231,000 | |
| Closed | Givens Rebecca | $240,800 |
Source: Public Records
Tax History
| Year | Tax Paid | Tax Assessment Tax Assessment Total Assessment is a certain percentage of the fair market value that is determined by local assessors to be the total taxable value of land and additions on the property. | Land | Improvement |
|---|---|---|---|---|
| 2025 | $2,576 | $106,675 | $18,300 | $88,375 |
| 2024 | $2,576 | $75,975 | $18,300 | $57,675 |
| 2023 | $4,628 | $75,975 | $18,300 | $57,675 |
| 2022 | $4,628 | $75,975 | $18,300 | $57,675 |
| 2021 | $4,682 | $75,975 | $18,300 | $57,675 |
| 2020 | $5,105 | $70,450 | $16,875 | $53,575 |
| 2019 | $2,252 | $70,450 | $16,875 | $53,575 |
| 2018 | $1,645 | $51,475 | $16,875 | $34,600 |
| 2017 | $1,684 | $51,475 | $16,875 | $34,600 |
| 2016 | $1,950 | $44,625 | $0 | $0 |
| 2014 | $1,950 | $44,625 | $0 | $0 |
Source: Public Records
Map
Nearby Homes
- 1044 Kings Park Rd
- 1207 W Perkins Rd
- 1235 Cherry Rd
- 4613 Crossover Ln
- 4474 Cherrydale Rd
- 1181 S Perkins Rd
- 931 Toscana Park Ct
- 4513 Park Ave
- 1168 S Perkins Rd
- 4557 Park Ave
- 1218 Merrycrest Dr
- 1269 W Perkins Rd
- 4305 Haverhill Rd
- 4522 Park Ave
- 4417 Fair Meadow Rd
- 883 Drake Manor Cove
- 4620 Amboy Rd
- 901 S Perkins Rd
- 4506 Verne Rd
- 4251 Woodcrest Dr
- 1107 Fair Meadow Rd
- 1095 Fairmeadow Rd
- 1121 Fairmeadow Rd
- 1131 Fairmeadow Rd
- 1087 Fairmeadow Rd
- 1108 Fair Meadow Rd
- 1141 Fair Meadow Rd
- 1108 Fairmeadow Rd
- 1098 Fairmeadow Rd
- 1098 Fair Meadow Rd
- 1120 Fairmeadow Rd
- 1077 Fairmeadow Rd
- 1141 Fairmeadow Rd
- 1130 Fairmeadow Rd
- 1088 Fairmeadow Rd
- 1067 Fairmeadow Rd
- 1142 Fairmeadow Rd
- 1078 Fair Meadow Rd
- 1078 Fairmeadow Rd
- 1159 Fairmeadow Rd
Your Personal Tour Guide
Ask me questions while you tour the home.