Estimated Value: $1,864,000 - $2,142,000
3
Beds
3
Baths
2,348
Sq Ft
$839/Sq Ft
Est. Value
About This Home
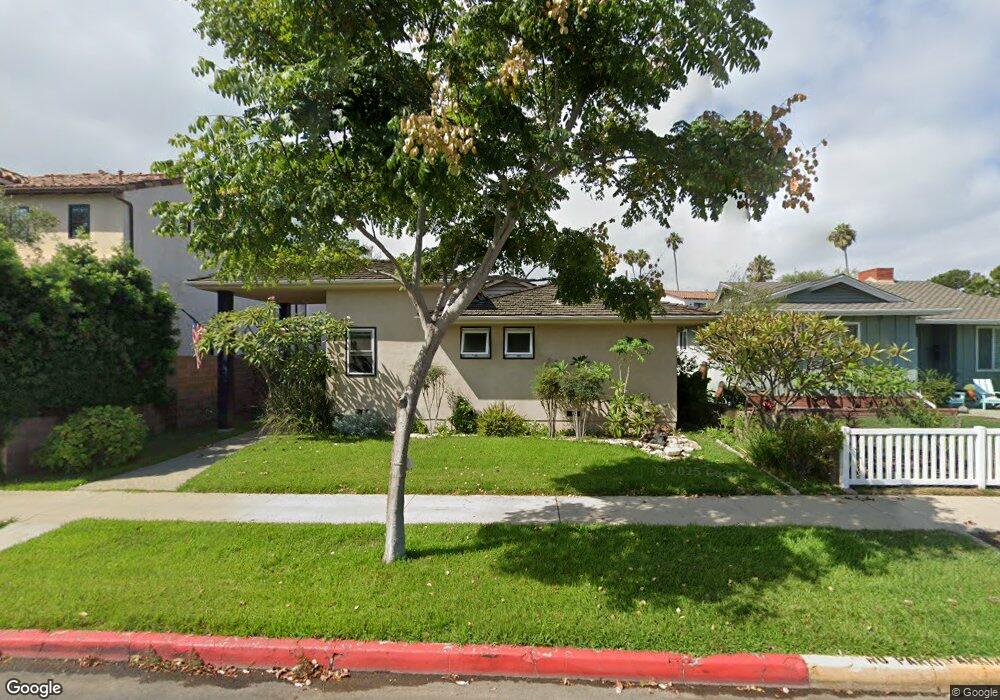
This home is located at 1107 Main St, Huntington Beach, CA 92648 and is currently estimated at $1,969,383, approximately $838 per square foot. 1107 Main St is a home located in Orange County with nearby schools including Agnes L. Smith Elementary, Ethel Dwyer Middle, and Huntington Beach High School.
Ownership History
Date
Name
Owned For
Owner Type
Purchase Details
Closed on
Apr 1, 2002
Sold by
Kunishige Rod and Kunishige Phyllis
Bought by
Kunishige Rodney E and Kunishige Phyllis
Current Estimated Value
Purchase Details
Closed on
Dec 12, 2000
Sold by
Cardwell Sandra Kay
Bought by
Cardwell Ernest R
Home Financials for this Owner
Home Financials are based on the most recent Mortgage that was taken out on this home.
Original Mortgage
$408,000
Outstanding Balance
$157,156
Interest Rate
8.33%
Estimated Equity
$1,812,227
Purchase Details
Closed on
Nov 29, 2000
Sold by
Cardwell Linda Joyce and Avdeef Lucile Arlene
Bought by
Kunishige Rod and Kunishige Phyllis
Home Financials for this Owner
Home Financials are based on the most recent Mortgage that was taken out on this home.
Original Mortgage
$408,000
Outstanding Balance
$157,156
Interest Rate
8.33%
Estimated Equity
$1,812,227
Create a Home Valuation Report for This Property
The Home Valuation Report is an in-depth analysis detailing your home's value as well as a comparison with similar homes in the area
Home Values in the Area
Average Home Value in this Area
Purchase History
| Date | Buyer | Sale Price | Title Company |
|---|---|---|---|
| Kunishige Rodney E | -- | -- | |
| Cardwell Ernest R | -- | Fidelity National Title Ins | |
| Kunishige Rod | $510,000 | Fidelity National Title Ins |
Source: Public Records
Mortgage History
| Date | Status | Borrower | Loan Amount |
|---|---|---|---|
| Open | Kunishige Rod | $408,000 |
Source: Public Records
Tax History Compared to Growth
Tax History
| Year | Tax Paid | Tax Assessment Tax Assessment Total Assessment is a certain percentage of the fair market value that is determined by local assessors to be the total taxable value of land and additions on the property. | Land | Improvement |
|---|---|---|---|---|
| 2025 | $1,937 | $150,123 | $27,006 | $123,117 |
| 2024 | $1,937 | $147,180 | $26,477 | $120,703 |
| 2023 | $1,889 | $144,295 | $25,958 | $118,337 |
| 2022 | $1,837 | $141,466 | $25,449 | $116,017 |
| 2021 | $1,803 | $138,693 | $24,950 | $113,743 |
| 2020 | $1,790 | $137,271 | $24,694 | $112,577 |
| 2019 | $1,770 | $134,580 | $24,210 | $110,370 |
| 2018 | $1,743 | $131,942 | $23,736 | $108,206 |
| 2017 | $1,718 | $129,355 | $23,270 | $106,085 |
| 2016 | $1,650 | $126,819 | $22,814 | $104,005 |
| 2015 | $1,631 | $124,915 | $22,472 | $102,443 |
| 2014 | $1,595 | $122,469 | $22,032 | $100,437 |
Source: Public Records
Map
Nearby Homes