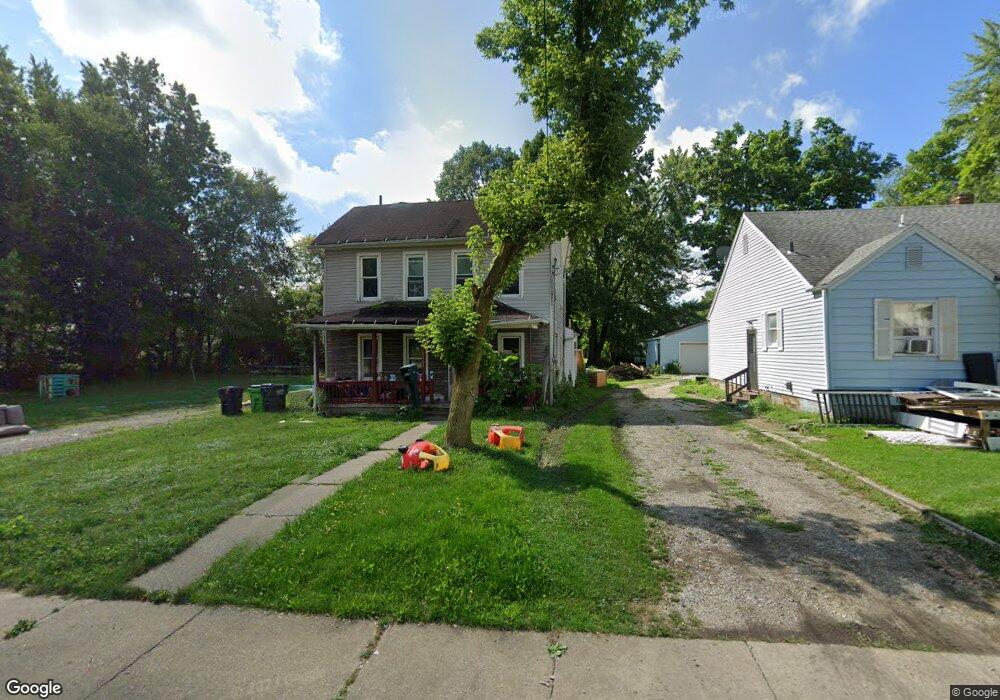
1107 Noble St Alliance, OH 44601
Estimated Value: $75,261 - $107,000
3
Beds
1
Bath
2,262
Sq Ft
$41/Sq Ft
Est. Value
About This Home
This home is located at 1107 Noble St, Alliance, OH 44601 and is currently estimated at $93,565, approximately $41 per square foot. 1107 Noble St is a home located in Stark County with nearby schools including Alliance Early Learning School, Alliance Intermediate School at Northside, and Alliance Middle School.
Ownership History
Date
Name
Owned For
Owner Type
Purchase Details
Closed on
Jun 14, 2023
Sold by
Barnhart Kristofor T
Bought by
Davis Jack E
Current Estimated Value
Purchase Details
Closed on
Dec 7, 2020
Sold by
Davis Jack E
Bought by
Barnhart Kristofor T
Home Financials for this Owner
Home Financials are based on the most recent Mortgage that was taken out on this home.
Original Mortgage
$16,000
Interest Rate
2.8%
Mortgage Type
Seller Take Back
Purchase Details
Closed on
Oct 23, 2015
Sold by
Fannie Mae
Bought by
Davis Jack E
Purchase Details
Closed on
Mar 9, 2015
Sold by
Hawkins John H and Hawkins John
Bought by
Federal National Mortgage Association
Purchase Details
Closed on
Feb 16, 2010
Sold by
Estate Of Dorothy T Hawkins
Bought by
Hawkins John H
Purchase Details
Closed on
Apr 8, 1998
Sold by
Triumpt Church Of New Ag
Bought by
Hawkins John and Hawkins Dorothy T
Create a Home Valuation Report for This Property
The Home Valuation Report is an in-depth analysis detailing your home's value as well as a comparison with similar homes in the area
Home Values in the Area
Average Home Value in this Area
Purchase History
| Date | Buyer | Sale Price | Title Company |
|---|---|---|---|
| Davis Jack E | -- | None Listed On Document | |
| Barnhart Kristofor T | $16,000 | None Available | |
| Davis Jack E | $4,000 | Servicelink | |
| Federal National Mortgage Association | $14,000 | None Available | |
| Hawkins John H | -- | None Available | |
| Hawkins John | $15,000 | -- |
Source: Public Records
Mortgage History
| Date | Status | Borrower | Loan Amount |
|---|---|---|---|
| Previous Owner | Barnhart Kristofor T | $16,000 |
Source: Public Records
Tax History
| Year | Tax Paid | Tax Assessment Tax Assessment Total Assessment is a certain percentage of the fair market value that is determined by local assessors to be the total taxable value of land and additions on the property. | Land | Improvement |
|---|---|---|---|---|
| 2025 | -- | $11,070 | $4,520 | $6,550 |
| 2024 | -- | $11,070 | $4,520 | $6,550 |
| 2023 | $931 | $6,860 | $910 | $5,950 |
| 2022 | $278 | $6,860 | $910 | $5,950 |
| 2021 | $278 | $6,860 | $910 | $5,950 |
| 2020 | $225 | $5,050 | $670 | $4,380 |
| 2019 | $222 | $5,050 | $670 | $4,380 |
Source: Public Records
Map
Nearby Homes
- 1226 Noble St
- 1025 Reed St
- 847 E Patterson St
- 361 E Main St
- 442 S Liberty Ave
- V/L S Freedom Ave
- 16190 River St NE
- 955 E Summit St
- 710 N Freedom Ave
- 000 Lexington Rd
- 62 E Market St
- 452 E Summit St
- 15832 Waverly St NE
- 505 N Union Ave
- 22862 Norman Ave
- 62 E High St
- 935 S Morgan Ave
- 726 S Arch Ave
- 11344 Walnut Ave NE
- 0 E Oxford St
- 1039 Noble St
- 1033 Noble St
- 1106 Noble St
- 1029 Noble St
- 1134 Noble St
- 1108 E Patterson St
- 1028 Noble St
- 1128 E Patterson St
- 224 Oak Ave
- 1019 Noble St
- 314 Oak Ave
- 1005 Noble St
- 1040 E Patterson St
- 1130 E Patterson St
- 1130 1134 E Patterson St
- 1100 E Patterson St
- 1146 E Patterson St
- 326 Oak Ave
- 1207 Noble St
- 1204 Noble St
Your Personal Tour Guide
Ask me questions while you tour the home.