Estimated Value: $148,000 - $170,000
3
Beds
2
Baths
1,069
Sq Ft
$151/Sq Ft
Est. Value
About This Home
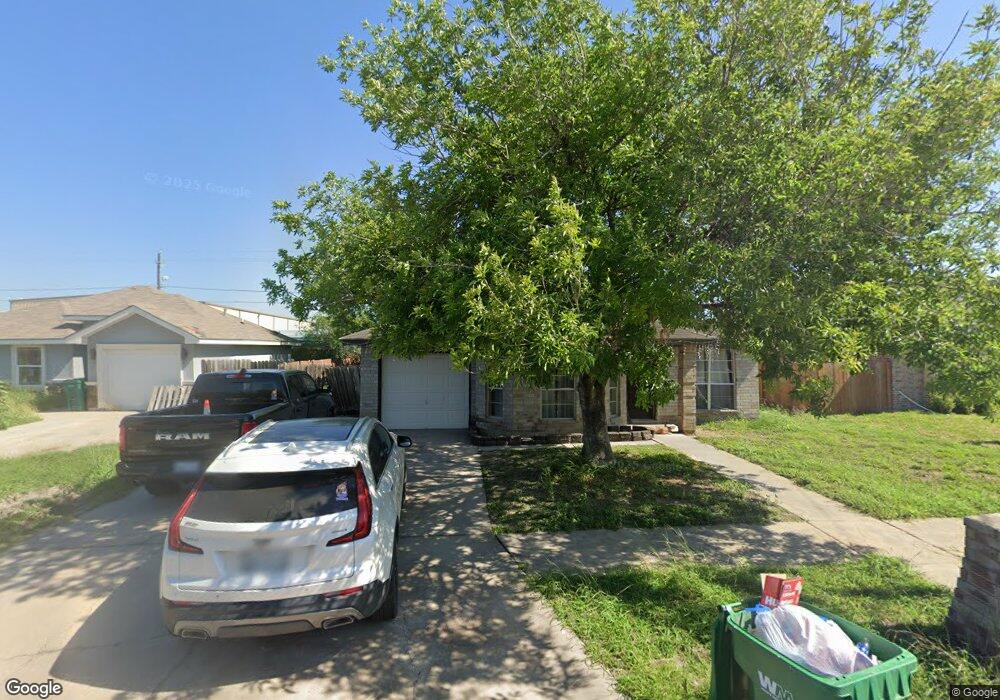
This home is located at 1107 Northpoint Dr, Pharr, TX 78577 and is currently estimated at $161,392, approximately $150 per square foot. 1107 Northpoint Dr is a home located in Hidalgo County with nearby schools including Raul Longoria Elementary School, Lyndon B. Johnson Middle School, and PSJA North Early College High School.
Ownership History
Date
Name
Owned For
Owner Type
Purchase Details
Closed on
May 30, 2008
Sold by
Garcia Jose Alfredo and Garcia Edelmira
Bought by
Carrasquero Nelson J
Current Estimated Value
Home Financials for this Owner
Home Financials are based on the most recent Mortgage that was taken out on this home.
Original Mortgage
$66,533
Outstanding Balance
$41,592
Interest Rate
5.89%
Mortgage Type
Purchase Money Mortgage
Estimated Equity
$119,800
Purchase Details
Closed on
Apr 19, 2007
Sold by
Pena Armando and Pena Esperanza G
Bought by
Garcia Jose Alfredo and Garcia Edelmira
Purchase Details
Closed on
Apr 16, 2007
Sold by
Hud
Bought by
Pena Armando
Purchase Details
Closed on
Jul 12, 2006
Sold by
National City Mortgage Inc
Bought by
Hud
Purchase Details
Closed on
Jul 4, 2006
Sold by
Escalante Oscar
Bought by
National City Mortgage Inc
Purchase Details
Closed on
Aug 22, 1996
Sold by
Villarreal Omar
Bought by
Gutierrez Sandra
Create a Home Valuation Report for This Property
The Home Valuation Report is an in-depth analysis detailing your home's value as well as a comparison with similar homes in the area
Home Values in the Area
Average Home Value in this Area
Purchase History
| Date | Buyer | Sale Price | Title Company |
|---|---|---|---|
| Carrasquero Nelson J | -- | Charge Sierra Title | |
| Garcia Jose Alfredo | -- | None Available | |
| Pena Armando | -- | First American Title Ins Co | |
| Hud | -- | None Available | |
| National City Mortgage Inc | $70,015 | None Available | |
| Gutierrez Sandra | -- | -- |
Source: Public Records
Mortgage History
| Date | Status | Borrower | Loan Amount |
|---|---|---|---|
| Open | Carrasquero Nelson J | $66,533 |
Source: Public Records
Tax History
| Year | Tax Paid | Tax Assessment Tax Assessment Total Assessment is a certain percentage of the fair market value that is determined by local assessors to be the total taxable value of land and additions on the property. | Land | Improvement |
|---|---|---|---|---|
| 2025 | $3,259 | $159,870 | $49,090 | $110,780 |
| 2024 | $3,259 | $121,504 | $44,627 | $76,877 |
| 2023 | $3,285 | $122,577 | $44,627 | $77,950 |
| 2022 | $2,761 | $98,433 | $27,212 | $71,221 |
| 2021 | $2,285 | $80,000 | $27,212 | $52,788 |
| 2020 | $2,008 | $69,424 | $27,212 | $42,212 |
| 2019 | $1,938 | $66,118 | $15,601 | $50,517 |
| 2018 | $1,990 | $67,531 | $15,601 | $51,930 |
| 2017 | $2,049 | $68,943 | $15,601 | $53,342 |
| 2016 | $1,967 | $66,162 | $15,601 | $50,561 |
| 2015 | $1,564 | $66,869 | $15,601 | $51,268 |
Source: Public Records
Map
Nearby Homes
- 4713 N Juniper St
- 912 E Brady Cir
- 905 E Brady Cir
- 313 E Meandering Way Ave
- 809 E Ferguson St
- 1007 E Bagwell St
- 1909 N Gumwood St
- 0 Ferguson Ave Unit 394023
- 1010 E Bagwell St
- 00 E Ferguson Ave
- 115 E Which Way
- 921 E Alan St
- 1218 E Alan St
- 1220 E Alan St
- 5704 N Ebony St
- 204 Lovely Way Ave
- 1808 Versailles Dr
- 1701 N Ebony St
- 0 N I Rd Unit 490797
- 1817 Monaco Dr
- 1105 Northpoint Dr
- 1109 Northpoint Dr
- 0000 Northpoint Dr
- 1111 Northpoint Dr
- 1100 Northpoint Dr
- 1100 Northpoint Dr
- 1106 Northpoint Dr
- 1113 Northpoint Dr
- 1108 Northpoint Dr
- 1104 Northpoint Dr
- 1110 Northpoint Dr
- 1115 Northpoint Dr
- 1112 Northpoint Dr
- 1114 Northpoint Dr
- 1201 Northpoint Dr
- 1015 E Ferguson St
- 1200 Northpoint Dr
- 1203 Northpoint Dr
- 1202 Northpoint Dr
- 1205 Northpoint Dr
Your Personal Tour Guide
Ask me questions while you tour the home.