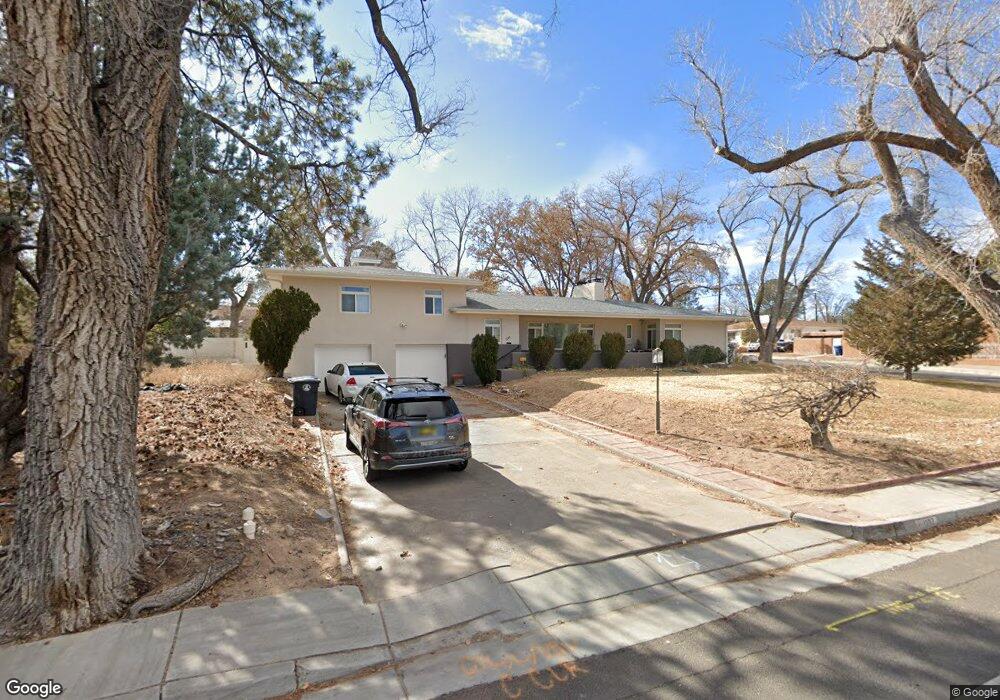
1107 Ridgecrest Dr SE Albuquerque, NM 87108
Southeast Heights NeighborhoodEstimated Value: $670,000 - $1,010,000
6
Beds
5
Baths
4,390
Sq Ft
$194/Sq Ft
Est. Value
About This Home
This home is located at 1107 Ridgecrest Dr SE, Albuquerque, NM 87108 and is currently estimated at $853,529, approximately $194 per square foot. 1107 Ridgecrest Dr SE is a home located in Bernalillo County with nearby schools including Whittier Elementary School, Wilson Middle School, and Highland High School.
Ownership History
Date
Name
Owned For
Owner Type
Purchase Details
Closed on
Oct 13, 2000
Sold by
Davidian Mark M and Davidian Leslie S
Bought by
Rosenberg Kevin M and Palmer Phyllis M
Current Estimated Value
Home Financials for this Owner
Home Financials are based on the most recent Mortgage that was taken out on this home.
Original Mortgage
$395,000
Outstanding Balance
$140,390
Interest Rate
7.75%
Estimated Equity
$713,139
Purchase Details
Closed on
Jun 10, 1999
Sold by
Custer Real Estate Family Ltd Prtnrshp
Bought by
Davidian Mark M and Davidian Leslie S
Home Financials for this Owner
Home Financials are based on the most recent Mortgage that was taken out on this home.
Original Mortgage
$280,000
Interest Rate
6.92%
Purchase Details
Closed on
Mar 23, 1998
Sold by
Custer Geo E and Custer Marjorie Duff
Bought by
George E & Marjorie Duff Custer Trust
Create a Home Valuation Report for This Property
The Home Valuation Report is an in-depth analysis detailing your home's value as well as a comparison with similar homes in the area
Home Values in the Area
Average Home Value in this Area
Purchase History
| Date | Buyer | Sale Price | Title Company |
|---|---|---|---|
| Rosenberg Kevin M | -- | Fidelity National Title Ins | |
| Davidian Mark M | -- | Fidelity National Title | |
| George E & Marjorie Duff Custer Trust | -- | -- |
Source: Public Records
Mortgage History
| Date | Status | Borrower | Loan Amount |
|---|---|---|---|
| Open | Rosenberg Kevin M | $395,000 | |
| Previous Owner | Davidian Mark M | $280,000 | |
| Closed | Davidian Mark M | $52,500 |
Source: Public Records
Tax History Compared to Growth
Tax History
| Year | Tax Paid | Tax Assessment Tax Assessment Total Assessment is a certain percentage of the fair market value that is determined by local assessors to be the total taxable value of land and additions on the property. | Land | Improvement |
|---|---|---|---|---|
| 2025 | $5,675 | $140,614 | $36,948 | $103,666 |
| 2024 | $5,675 | $136,518 | $35,872 | $100,646 |
| 2023 | $5,579 | $132,543 | $34,828 | $97,715 |
| 2022 | $5,388 | $128,682 | $33,813 | $94,869 |
| 2021 | $5,205 | $124,935 | $32,829 | $92,106 |
| 2020 | $5,117 | $121,296 | $31,873 | $89,423 |
| 2019 | $4,964 | $117,764 | $30,945 | $86,819 |
| 2018 | $4,785 | $117,764 | $30,945 | $86,819 |
| 2017 | $4,636 | $114,334 | $30,043 | $84,291 |
| 2016 | $4,500 | $107,771 | $28,319 | $79,452 |
| 2015 | $104,633 | $104,633 | $27,495 | $77,138 |
| 2014 | $4,229 | $101,586 | $26,694 | $74,892 |
| 2013 | -- | $98,628 | $25,917 | $72,711 |
Source: Public Records
Map
Nearby Homes
- 805 Ridgecrest Dr SE
- 3909 Simms Ave SE
- 3801 Simms Ave SE
- 521 Graceland Dr SE
- 1017 Jefferson St SE
- 502 Graceland Dr SE
- 611 Carlisle Blvd SE
- 4800 Southern Ave SE
- 659 Monroe St SE
- 4816 Ridgecrest Cir SE
- 3529 Ross Ave SE
- 1017 Pampas Dr SE
- 3418 Smith Ave SE
- 3534 Vail Ave SE
- 3412 Anderson Ave SE
- 3403 Anderson Ave SE
- 3436 Ross Ave SE
- 1020 Jackson St SE
- 3513 Crest Ave SE
- 410 Amherst Dr SE
- 1002 Parkland Cir SE
- 1011 Ridgecrest Dr SE
- 1111 Ridgecrest Dr SE
- 1011 Parkland Place SE
- 1000 Parkland Cir SE
- 1007 Ridgecrest Dr SE
- 1009 Parkland Cir SE
- 1009 Parkland Cir SE
- 1102 Ridgecrest Dr SE
- 1010 Ridgecrest Dr SE
- 1019 Parkland Place SE
- 1104 Ridgecrest Dr SE
- 1007 Parkland Cir SE
- 1001 Sunrise Place SE
- 1106 Ridgecrest Dr SE
- 1016 Parkland Place SE
- 1012 Parkland Place SE
- 1010 Parkland Place SE
- 1001 Ridgecrest Dr SE
- 1008 Parkland Place SE