

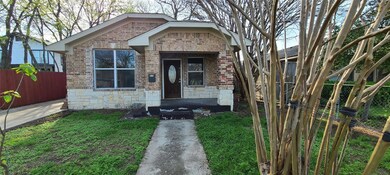

1107 S Waverly Dr Dallas, TX 75208
Winnetka Heights Neighborhood
3
Beds
3
Baths
1,600
Sq Ft
7,057
Sq Ft Lot
Highlights
- Traditional Architecture
- Home Security System
- 1-Story Property
- Fence Around Pool
- Brick Flooring
- Central Heating and Cooling System
About This Home
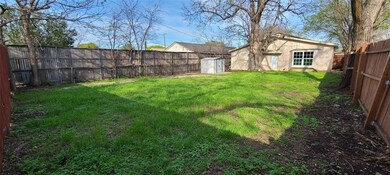
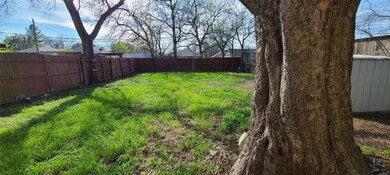
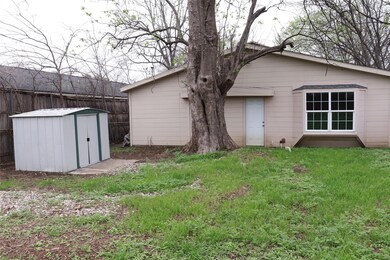
As of May 2025Let’s See Your Offers!Excellent South Dallas Location! 3 Large bedrooms, 3 Full baths. Recent HVAC, Plumbing and 200 Amp Electrical upgrade. Brushed Satin 2 Door Refrigerator, Microwave and Washer and Dryer included in sale. Security system with surveillance cameras. Fenced yard. Many upgrades to enjoy.Property has a huge backyard! New owner may consider adding a rear entry garage or carport access from the back!Offered 'AS IS'. Property may need some front porch and floor tile repair.
Last Agent to Sell the Property
Tom Costello Real Estate Brokerage Phone: 972-291-3374 License #0451445 Listed on: 02/28/2024
Home Details
Home Type
- Single Family
Est. Annual Taxes
- $6,505
Year Built
- Built in 1925
Lot Details
- 7,057 Sq Ft Lot
- Front Yard Fenced and Back Yard
- High Fence
- Chain Link Fence
Parking
- Driveway
Home Design
- Traditional Architecture
- Brick Exterior Construction
- Combination Foundation
- Slab Foundation
- Composition Roof
- Stone Veneer
Interior Spaces
- 1,600 Sq Ft Home
- 1-Story Property
- Home Security System
- Dryer
Kitchen
- Electric Oven
- Electric Cooktop
- Microwave
Flooring
- Brick
- Tile
Bedrooms and Bathrooms
- 3 Bedrooms
- 3 Full Bathrooms
Pool
- Fence Around Pool
Schools
- Winnetka Elementary School
- Sunset High School
Utilities
- Central Heating and Cooling System
- Electric Water Heater
- Cable TV Available
Community Details
- Sunset Annex Subdivision
Listing and Financial Details
- Legal Lot and Block 11 / 3/355
- Assessor Parcel Number 00000278365000000
Ownership History
Date
Name
Owned For
Owner Type
Purchase Details
Closed on
Aug 15, 2017
Sold by
Magallanes Adriana
Bought by
Hunt Jason
Home Financials for this Owner
Home Financials are based on the most recent Mortgage that was taken out on this home.
Original Mortgage
$174,250
Interest Rate
3.96%
Mortgage Type
New Conventional
Purchase Details
Closed on
Jun 30, 2016
Sold by
Magallanes Adriana
Bought by
A&D Diamond Homes Llc
Purchase Details
Closed on
Sep 22, 2008
Sold by
Hernandez Jose De Jesus
Bought by
Alvarez Rosalinda
Purchase Details
Closed on
Mar 11, 2003
Sold by
Hernandez Mario and Hernandez Mary
Bought by
Cpr Auto Sales Inc
Similar Homes in Dallas, TX
Create a Home Valuation Report for This Property
The Home Valuation Report is an in-depth analysis detailing your home's value as well as a comparison with similar homes in the area
Home Values in the Area
Average Home Value in this Area
Purchase History
| Date | Type | Sale Price | Title Company |
|---|---|---|---|
| Vendors Lien | -- | None Available | |
| Warranty Deed | -- | None Available | |
| Warranty Deed | -- | None Available | |
| Warranty Deed | -- | None Available | |
| Warranty Deed | -- | -- |
Source: Public Records
Mortgage History
| Date | Status | Loan Amount | Loan Type |
|---|---|---|---|
| Open | $325,000 | New Conventional | |
| Closed | $174,250 | New Conventional |
Source: Public Records
Property History
| Date | Event | Price | Change | Sq Ft Price |
|---|---|---|---|---|
| 05/27/2025 05/27/25 | Sold | -- | -- | -- |
| 05/02/2025 05/02/25 | Pending | -- | -- | -- |
| 04/22/2025 04/22/25 | For Sale | $375,000 | +50.0% | $197 / Sq Ft |
| 03/27/2025 03/27/25 | Off Market | -- | -- | -- |
| 02/10/2025 02/10/25 | For Sale | $250,000 | 0.0% | $156 / Sq Ft |
| 02/09/2025 02/09/25 | Off Market | -- | -- | -- |
| 02/09/2025 02/09/25 | For Sale | $250,000 | 0.0% | $156 / Sq Ft |
| 01/24/2025 01/24/25 | Off Market | -- | -- | -- |
| 01/24/2025 01/24/25 | For Sale | $250,000 | 0.0% | $156 / Sq Ft |
| 01/15/2025 01/15/25 | Sold | -- | -- | -- |
| 12/26/2024 12/26/24 | Pending | -- | -- | -- |
| 10/15/2024 10/15/24 | Price Changed | $250,000 | -16.4% | $156 / Sq Ft |
| 09/27/2024 09/27/24 | Price Changed | $299,000 | -3.5% | $187 / Sq Ft |
| 06/30/2024 06/30/24 | Price Changed | $310,000 | -3.1% | $194 / Sq Ft |
| 06/16/2024 06/16/24 | Price Changed | $320,000 | -3.0% | $200 / Sq Ft |
| 06/01/2024 06/01/24 | Price Changed | $330,000 | -2.9% | $206 / Sq Ft |
| 05/18/2024 05/18/24 | Price Changed | $340,000 | -2.9% | $213 / Sq Ft |
| 03/16/2024 03/16/24 | For Sale | $350,000 | -- | $219 / Sq Ft |
Source: North Texas Real Estate Information Systems (NTREIS)
Tax History Compared to Growth
Tax History
| Year | Tax Paid | Tax Assessment Tax Assessment Total Assessment is a certain percentage of the fair market value that is determined by local assessors to be the total taxable value of land and additions on the property. | Land | Improvement |
|---|---|---|---|---|
| 2024 | $4,431 | $332,670 | $150,000 | $182,670 |
| 2023 | $4,431 | $283,470 | $150,000 | $133,470 |
| 2022 | $5,942 | $237,630 | $65,000 | $172,630 |
| 2021 | $6,269 | $237,630 | $65,000 | $172,630 |
| 2020 | $5,619 | $207,120 | $30,000 | $177,120 |
| 2019 | $5,893 | $207,120 | $30,000 | $177,120 |
| 2018 | $4,654 | $207,120 | $30,000 | $177,120 |
| 2017 | $2,612 | $96,050 | $30,000 | $66,050 |
| 2016 | $2,612 | $96,050 | $30,000 | $66,050 |
| 2015 | $2,024 | $78,120 | $24,000 | $54,120 |
| 2014 | $2,024 | $73,800 | $20,000 | $53,800 |
Source: Public Records
Agents Affiliated with this Home
-
Keonna Windom
K
Seller's Agent in 2025
Keonna Windom
Keller Williams Rockwall
(469) 371-9123
2 in this area
7 Total Sales
-
Tom Costello
T
Seller's Agent in 2025
Tom Costello
Tom Costello Real Estate
(214) 914-8483
2 in this area
6 Total Sales
-
Ashwin Vidiyala
A
Buyer's Agent in 2025
Ashwin Vidiyala
Vylla Home
(817) 984-5347
1 in this area
1 Total Sale
Map
Source: North Texas Real Estate Information Systems (NTREIS)
MLS Number: 20547931
APN: 00000278365000000
Disclaimer: Certain information contained herein is derived from information provided by parties other than Homes.com. All information provided is deemed reliable, but is not guaranteed to be accurate and should be independently verified.
![]() Listing information provided in part by the North Texas Real Estate Information Systems, Inc, for personal, non-commercial use by viewers of this site and may not be reproduced or redistributed. All information is deemed reliable but not guaranteed. Copyright © NTREIS 2025. All rights reserved
Listing information provided in part by the North Texas Real Estate Information Systems, Inc, for personal, non-commercial use by viewers of this site and may not be reproduced or redistributed. All information is deemed reliable but not guaranteed. Copyright © NTREIS 2025. All rights reserved
Nearby Homes
- 902 S Waverly Dr
- 1009 S Waverly Dr
- 922 S Waverly Dr
- 925 S Brighton Ave
- 929 S Rosemont Ave
- 1011 S Montclair Ave
- 1219 S Waverly Dr
- 929 S Marlborough Ave
- 1122 S Montclair Ave
- 1625 Brandon St
- 1025 S Oak Cliff Blvd
- 1607 Brandon St
- 1316 S Waverly Dr
- 910 S Windomere Ave
- 1306 S Oak Cliff Blvd
- 810 S Montclair Ave
- 711 S Rosemont Ave
- 1413 S Waverly Dr
- 901 S Montreal Ave
- 1118 Hollywood Ave