Estimated Value: $310,463 - $354,000
3
Beds
2
Baths
2,278
Sq Ft
$146/Sq Ft
Est. Value
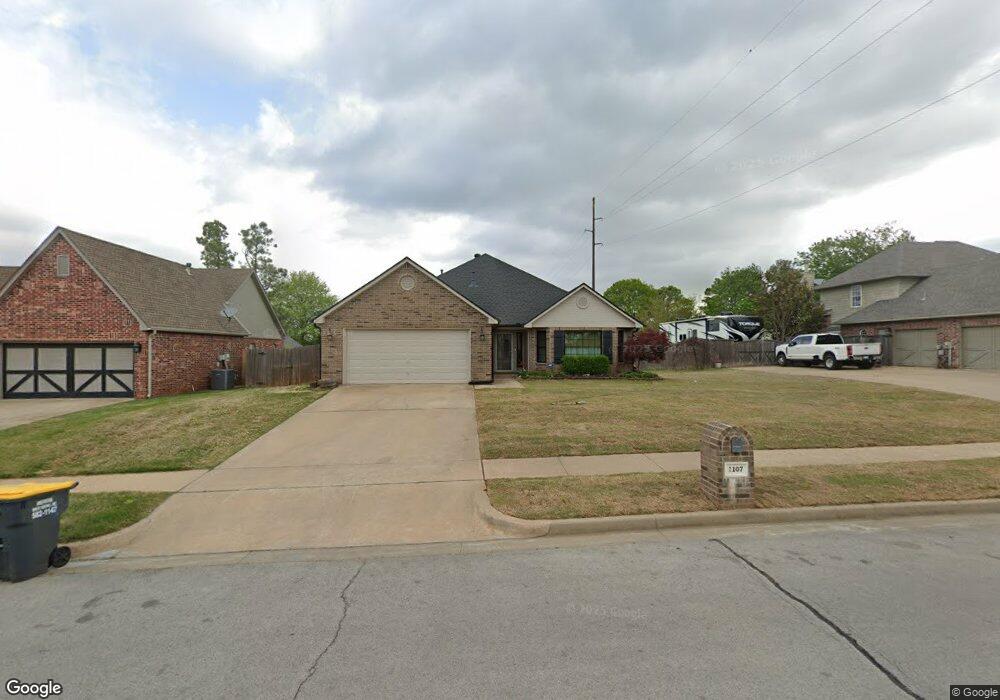
About This Home
This home is located at 1107 W 115th Place S, Jenks, OK 74037 and is currently estimated at $332,616, approximately $146 per square foot. 1107 W 115th Place S is a home located in Tulsa County with nearby schools including Jenks West Elementary School, Jenks West Intermediate Elementary School, and Jenks Middle School.
Ownership History
Date
Name
Owned For
Owner Type
Purchase Details
Closed on
Nov 25, 2009
Sold by
Campbell Barbara Sue and Shipman Barbara Sue
Bought by
Shipman Barbara Sue
Current Estimated Value
Purchase Details
Closed on
Apr 14, 2009
Sold by
Shipman Ronald D and Shipman Barbara S
Bought by
Erwin Matt S and Erwin Niki L
Home Financials for this Owner
Home Financials are based on the most recent Mortgage that was taken out on this home.
Original Mortgage
$184,978
Outstanding Balance
$118,186
Interest Rate
5.14%
Mortgage Type
FHA
Estimated Equity
$214,430
Purchase Details
Closed on
Oct 4, 2001
Sold by
Shipman Doris S
Bought by
Shipman Ronald D
Purchase Details
Closed on
May 21, 1999
Sold by
Wallace Properties Inc
Bought by
Taylorbilt Homes Inc
Home Financials for this Owner
Home Financials are based on the most recent Mortgage that was taken out on this home.
Original Mortgage
$136,000
Interest Rate
6.89%
Mortgage Type
Construction
Create a Home Valuation Report for This Property
The Home Valuation Report is an in-depth analysis detailing your home's value as well as a comparison with similar homes in the area
Home Values in the Area
Average Home Value in this Area
Purchase History
| Date | Buyer | Sale Price | Title Company |
|---|---|---|---|
| Shipman Barbara Sue | -- | None Available | |
| Erwin Matt S | $191,500 | None Available | |
| Shipman Ronald D | -- | -- | |
| Taylorbilt Homes Inc | $28,000 | -- |
Source: Public Records
Mortgage History
| Date | Status | Borrower | Loan Amount |
|---|---|---|---|
| Open | Erwin Matt S | $184,978 | |
| Previous Owner | Taylorbilt Homes Inc | $136,000 |
Source: Public Records
Tax History Compared to Growth
Tax History
| Year | Tax Paid | Tax Assessment Tax Assessment Total Assessment is a certain percentage of the fair market value that is determined by local assessors to be the total taxable value of land and additions on the property. | Land | Improvement |
|---|---|---|---|---|
| 2024 | $2,768 | $22,426 | $2,723 | $19,703 |
| 2023 | $2,768 | $22,743 | $2,761 | $19,982 |
| 2022 | $2,839 | $22,081 | $3,315 | $18,766 |
| 2021 | $2,738 | $21,029 | $3,157 | $17,872 |
| 2020 | $2,678 | $21,029 | $3,157 | $17,872 |
| 2019 | $2,696 | $21,029 | $3,157 | $17,872 |
| 2018 | $2,715 | $21,029 | $3,157 | $17,872 |
| 2017 | $2,670 | $21,029 | $3,157 | $17,872 |
| 2016 | $2,736 | $21,029 | $3,157 | $17,872 |
| 2015 | $2,788 | $21,029 | $3,157 | $17,872 |
| 2014 | $2,856 | $21,065 | $3,157 | $17,908 |
Source: Public Records
Map
Nearby Homes
- 11515 S Mulberry Ct
- 12004 S Nandina Ave
- 11527 S Nandina Place
- 1615 W 115th Place
- 11220 S Fir Ave
- 11212 S Fir Ave
- 110 W 113th St S
- 11920 S Holley St
- 11260 S Fir Ave
- 691 W 113th Ct S
- 682 W 113th Ct S
- 1623 W 114th St
- 11264 S Fir Ave
- 11312 S Fir Ave
- 11308 S Fir Ave
- 11265 S Fir Ave
- 11261 S Fir Ave
- 119 W 119th St
- 11224 S Fir Ave
- 626 W 120th St S
- 1111 W 115th Place S
- 3125 W 115th Place S
- 1103 W 115th Place S
- 11515 S Locust Ave
- 11517 S Locust Ave
- 11523 S Locust Ave
- 1101 W 115th Place S
- 1106 W 115th Place S
- 1110 W 115th Place S
- 1102 W 115th Place S
- 11513 S Locust Ave
- 1202 W 115th Place S
- 11519 S Locust Ave
- 11524 S Juniper St
- 1204 W 115th Place S
- 11520 S Juniper St
- 11511 S Locust Ave
- 1028 W 115th Place S
- 11520 S Locust Ave
- 11518 S Locust Ave