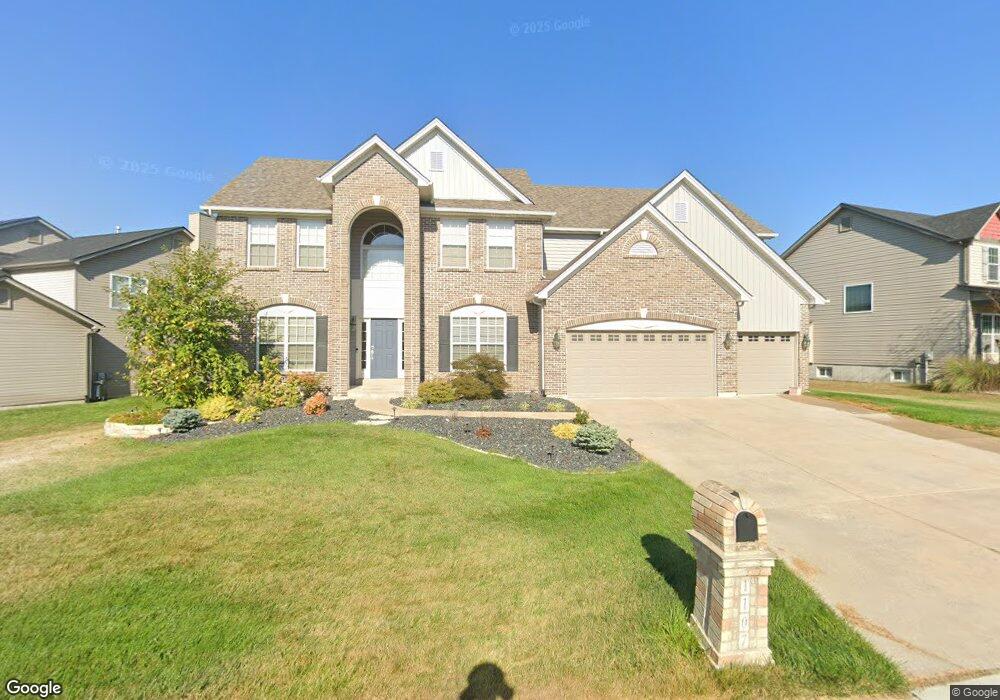
1107 Water View Ln O Fallon, MO 63366
Estimated Value: $484,427 - $739,000
4
Beds
4
Baths
3,688
Sq Ft
$159/Sq Ft
Est. Value
About This Home
This home is located at 1107 Water View Ln, O Fallon, MO 63366 and is currently estimated at $585,357, approximately $158 per square foot. 1107 Water View Ln is a home located in St. Charles County with nearby schools including Mount Hope Elementary School, Fort Zumwalt North Middle School, and Fort Zumwalt North High School.
Ownership History
Date
Name
Owned For
Owner Type
Purchase Details
Closed on
Jul 21, 2021
Sold by
Selvy Andrew D and Selvy Katie R
Bought by
Katie R Selvy And Andrew D Selvy Revocable Li and Selvy
Current Estimated Value
Purchase Details
Closed on
Jul 30, 2009
Sold by
Prudential Relocation Inc
Bought by
Selvy Andrew D and Selvy Katie R
Home Financials for this Owner
Home Financials are based on the most recent Mortgage that was taken out on this home.
Original Mortgage
$35,600
Interest Rate
5.31%
Mortgage Type
New Conventional
Purchase Details
Closed on
Apr 21, 2005
Sold by
Mckelvey Homes Llc
Bought by
Babb Terry K and Babb Kori
Home Financials for this Owner
Home Financials are based on the most recent Mortgage that was taken out on this home.
Original Mortgage
$275,000
Interest Rate
4.75%
Mortgage Type
New Conventional
Create a Home Valuation Report for This Property
The Home Valuation Report is an in-depth analysis detailing your home's value as well as a comparison with similar homes in the area
Home Values in the Area
Average Home Value in this Area
Purchase History
| Date | Buyer | Sale Price | Title Company |
|---|---|---|---|
| Katie R Selvy And Andrew D Selvy Revocable Li | -- | None Listed On Document | |
| Selvy Andrew D | -- | Sec | |
| Prudential Relocation Inc | $356,000 | Security Title | |
| Babb Terry K | -- | Ust |
Source: Public Records
Mortgage History
| Date | Status | Borrower | Loan Amount |
|---|---|---|---|
| Previous Owner | Prudential Relocation Inc | $35,600 | |
| Previous Owner | Selvy Andrew D | $284,800 | |
| Previous Owner | Babb Terry K | $275,000 |
Source: Public Records
Tax History
| Year | Tax Paid | Tax Assessment Tax Assessment Total Assessment is a certain percentage of the fair market value that is determined by local assessors to be the total taxable value of land and additions on the property. | Land | Improvement |
|---|---|---|---|---|
| 2025 | $6,106 | $99,355 | -- | -- |
| 2023 | $6,108 | $92,663 | -- | -- |
| 2022 | $5,284 | $74,538 | $0 | $0 |
| 2021 | $5,288 | $74,538 | $0 | $0 |
| 2020 | $4,915 | $67,039 | $0 | $0 |
| 2019 | $4,927 | $67,039 | $0 | $0 |
| 2018 | $4,509 | $58,553 | $0 | $0 |
| 2017 | $4,461 | $58,553 | $0 | $0 |
| 2016 | $4,234 | $55,356 | $0 | $0 |
| 2015 | $3,936 | $55,356 | $0 | $0 |
| 2014 | $3,983 | $55,071 | $0 | $0 |
Source: Public Records
Map
Nearby Homes
- 1548 Hunters Meadow Dr
- 1550 Hunters Meadow Dr
- 6 Emerson Ct
- 849 Elaine Dr
- 24 Hawthorne Ct
- 1373 New Charter Ln
- 734 Sunset Ln
- 1020 Ashfield Ln
- 319 Narrowleaf Ln
- 12 Summer Ct
- 1 Manderly Place Dr
- 765 Koch Rd
- 6 S Boxwood Ln
- 3.59 Acres Matteson Blvd
- 7.19 Acres Matteson Blvd
- 3.6 Acres Matteson Blvd
- 990 Stonecastle Dr
- 0 Montbrook Dr
- 201 Old Schaeffer Ln
- 1215 Cypress Dr
- 1111 Water View Ln
- 1212 Valley Pass Dr
- 1210 Valley Pass Dr
- 1618 Foggy Meadow Dr
- 1108 Water View Ln
- 1115 Water View Ln
- 1104 Water View Ln
- 1110 Water View Ln
- 1616 Foggy Meadow Dr
- 1112 Water View Ln
- 1102 Water View Ln
- 1114 Water View Ln
- 1207 Valley Pass Dr
- 1211 Valley Pass Dr
- 37 Deer Creek Dr
- 1213 Valley Pass Dr
- 1209 Valley Pass Dr
- 1619 Foggy Meadow Dr
- 1617 Foggy Meadow Dr
- 43 Deer Creek Dr
Your Personal Tour Guide
Ask me questions while you tour the home.