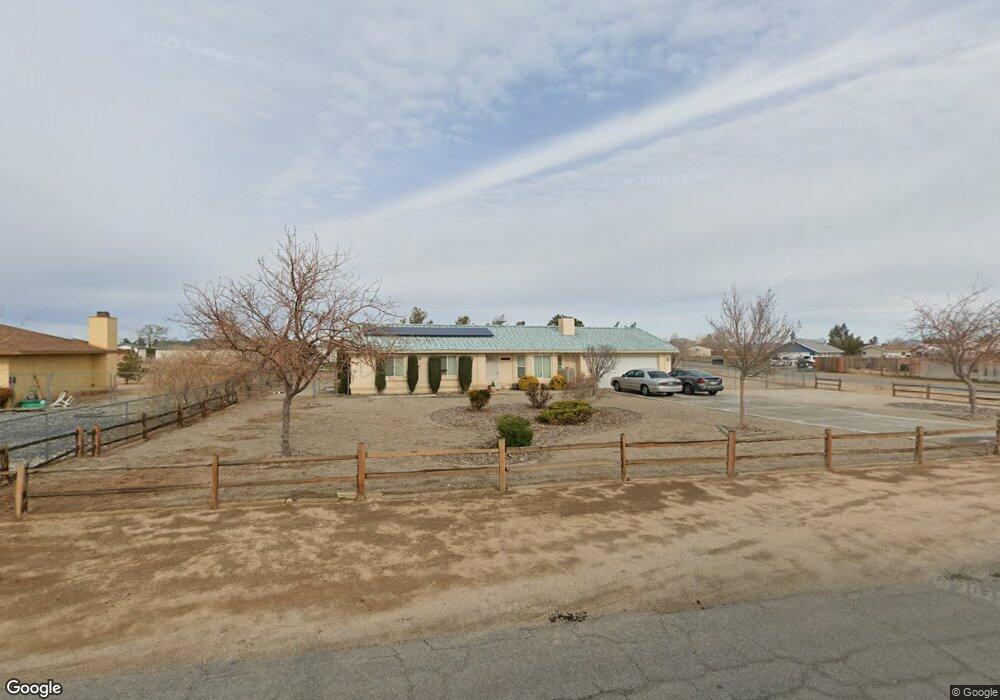
11070 Lancelet Ave Apple Valley, CA 92308
High Desert NeighborhoodEstimated Value: $350,000 - $386,716
3
Beds
2
Baths
1,218
Sq Ft
$303/Sq Ft
Est. Value
About This Home
This home is located at 11070 Lancelet Ave, Apple Valley, CA 92308 and is currently estimated at $368,929, approximately $302 per square foot. 11070 Lancelet Ave is a home located in San Bernardino County with nearby schools including Sandia Elementary School and Apple Valley High School.
Ownership History
Date
Name
Owned For
Owner Type
Purchase Details
Closed on
Apr 21, 2009
Sold by
Secretary Of Housing & Urban Development
Bought by
Brockett Gene R and Brockett Linda K
Current Estimated Value
Home Financials for this Owner
Home Financials are based on the most recent Mortgage that was taken out on this home.
Original Mortgage
$101,648
Interest Rate
4.99%
Mortgage Type
FHA
Purchase Details
Closed on
Aug 12, 2008
Sold by
Citimortgage Inc
Bought by
Hud
Purchase Details
Closed on
Jun 26, 2003
Sold by
Chavez Ronald
Bought by
Rampenthal Jason Robert
Home Financials for this Owner
Home Financials are based on the most recent Mortgage that was taken out on this home.
Original Mortgage
$98,400
Interest Rate
6.75%
Mortgage Type
Purchase Money Mortgage
Purchase Details
Closed on
Jan 16, 2003
Sold by
Mcbride Lolly L
Bought by
Chavez Ronald and Chavez Tracy J
Create a Home Valuation Report for This Property
The Home Valuation Report is an in-depth analysis detailing your home's value as well as a comparison with similar homes in the area
Home Values in the Area
Average Home Value in this Area
Purchase History
| Date | Buyer | Sale Price | Title Company |
|---|---|---|---|
| Brockett Gene R | $100,000 | Stewart Title Company | |
| Hud | -- | First American | |
| Citimortgage Inc | $264,467 | First American | |
| Rampenthal Jason Robert | $126,000 | American Title | |
| Chavez Ronald | $15,500 | American Title |
Source: Public Records
Mortgage History
| Date | Status | Borrower | Loan Amount |
|---|---|---|---|
| Previous Owner | Brockett Gene R | $101,648 | |
| Previous Owner | Rampenthal Jason Robert | $98,400 | |
| Closed | Rampenthal Jason Robert | $24,600 |
Source: Public Records
Tax History
| Year | Tax Paid | Tax Assessment Tax Assessment Total Assessment is a certain percentage of the fair market value that is determined by local assessors to be the total taxable value of land and additions on the property. | Land | Improvement |
|---|---|---|---|---|
| 2025 | $2,573 | $128,781 | $32,197 | $96,584 |
| 2024 | $2,529 | $126,256 | $31,566 | $94,690 |
| 2023 | $2,514 | $123,780 | $30,947 | $92,833 |
| 2022 | $2,490 | $121,353 | $30,340 | $91,013 |
| 2021 | $2,382 | $118,973 | $29,745 | $89,228 |
| 2020 | $2,364 | $117,753 | $29,440 | $88,313 |
| 2019 | $2,337 | $115,444 | $28,863 | $86,581 |
| 2018 | $2,302 | $113,180 | $28,297 | $84,883 |
| 2017 | $2,242 | $110,961 | $27,742 | $83,219 |
| 2016 | $1,230 | $108,785 | $27,198 | $81,587 |
| 2015 | $1,211 | $107,150 | $26,789 | $80,361 |
| 2014 | $1,193 | $105,051 | $26,264 | $78,787 |
Source: Public Records
Map
Nearby Homes
- 11161 Merino Ave
- 11182 Caribou Ave
- 43431107 Kiowa Place
- 10911 Caribou Ave
- 20489 Wren St
- 10350 Merino Ave
- 11092 Saratoga Rd
- 3 Del Oro Rd
- 11414 Serra Rd Unit 15
- 11414 Serra Rd
- 11414 Serra Rd Unit 46
- 11135 Truchas Rd
- 20997 Valencia St
- 21055 Valencia St
- 11542 Chimayo Rd
- 21044 Wisteria St
- 11550 Itoya Vista St
- 21305 Wren St
- 11410 Cibola Rd
- 11679 Winterhawk Way
- 11054 Lancelet Ave
- 11080 Lancelet Rd
- 11120 Merino Ave
- 11095 Caribou Ave
- 11080 Lancelet Ave
- 11081 Caribou Ave
- 11061 Lancelet Ave
- 11040 Lancelet Ave
- 11131 Caribou Ave
- 11067 Caribou Ave
- 11090 Lancelet Ave
- 11077 Lancelet Ave
- 11035 Lancelet Ave
- 11143 Caribou Ave
- 11053 Caribou Ave
- 11042 Merino Ave
- 11022 Lancelet Ave
- 11095 Lancelet Ave
- 11104 Lancelet Ave
- 11110 Caribou Ave