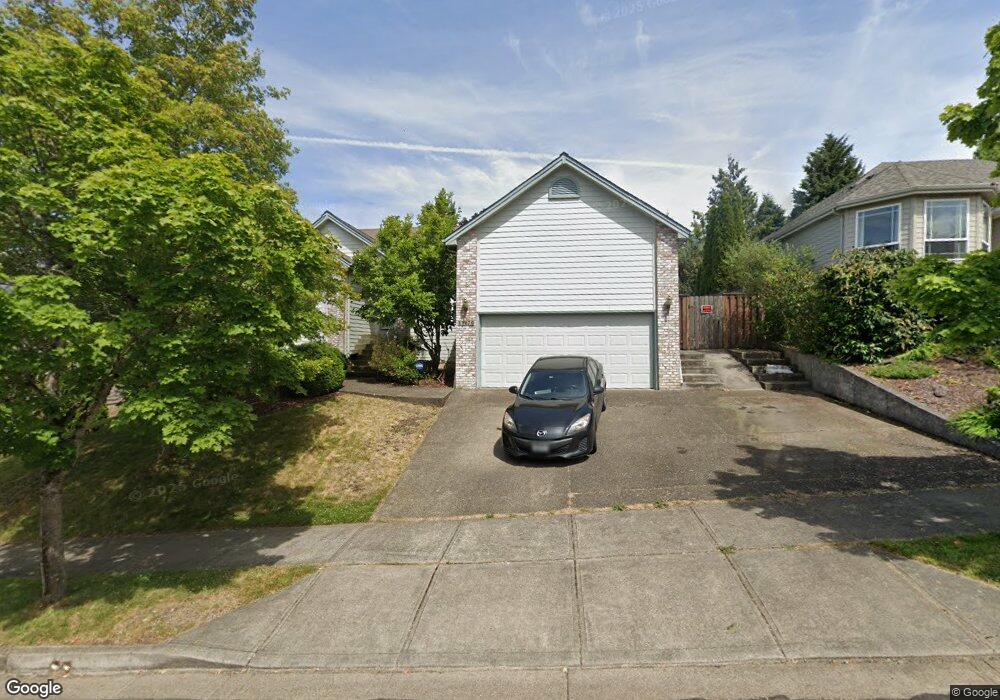
11070 SE Alexander Ave Happy Valley, OR 97086
Estimated Value: $566,743 - $655,000
3
Beds
2
Baths
1,860
Sq Ft
$331/Sq Ft
Est. Value
About This Home
This home is located at 11070 SE Alexander Ave, Happy Valley, OR 97086 and is currently estimated at $615,686, approximately $331 per square foot. 11070 SE Alexander Ave is a home located in Clackamas County with nearby schools including Spring Mountain Elementary School, Rock Creek Middle School, and Clackamas High School.
Ownership History
Date
Name
Owned For
Owner Type
Purchase Details
Closed on
Sep 15, 2011
Sold by
Denham Chad M
Bought by
Denham Chad M and Denham Junko
Current Estimated Value
Purchase Details
Closed on
Apr 18, 2005
Sold by
Almassou Jeorgette and Almassou Georgette
Bought by
Denham Chad
Home Financials for this Owner
Home Financials are based on the most recent Mortgage that was taken out on this home.
Original Mortgage
$138,000
Interest Rate
5.77%
Mortgage Type
Purchase Money Mortgage
Purchase Details
Closed on
Dec 27, 2004
Sold by
Ramadan Hassan
Bought by
Almassou Jeorgette
Purchase Details
Closed on
Oct 5, 2004
Sold by
Almasson Jeorgette
Bought by
Ramadan Hossan
Purchase Details
Closed on
Jan 19, 2000
Sold by
Sandstrum Homes Inc
Bought by
Almassou Jeorgette
Home Financials for this Owner
Home Financials are based on the most recent Mortgage that was taken out on this home.
Original Mortgage
$179,287
Interest Rate
7%
Mortgage Type
Stand Alone First
Create a Home Valuation Report for This Property
The Home Valuation Report is an in-depth analysis detailing your home's value as well as a comparison with similar homes in the area
Home Values in the Area
Average Home Value in this Area
Purchase History
| Date | Buyer | Sale Price | Title Company |
|---|---|---|---|
| Denham Chad M | -- | None Available | |
| Denham Chad | $278,000 | Transnation Title Agency Or | |
| Almassou Jeorgette | -- | -- | |
| Ramadan Hossan | -- | -- | |
| Almassou Jeorgette | $204,900 | Chicago Title |
Source: Public Records
Mortgage History
| Date | Status | Borrower | Loan Amount |
|---|---|---|---|
| Closed | Denham Chad | $138,000 | |
| Previous Owner | Almassou Jeorgette | $179,287 |
Source: Public Records
Tax History Compared to Growth
Tax History
| Year | Tax Paid | Tax Assessment Tax Assessment Total Assessment is a certain percentage of the fair market value that is determined by local assessors to be the total taxable value of land and additions on the property. | Land | Improvement |
|---|---|---|---|---|
| 2024 | $6,402 | $324,118 | -- | -- |
| 2023 | $6,402 | $314,678 | $0 | $0 |
| 2022 | $5,896 | $305,513 | $0 | $0 |
| 2021 | $5,555 | $296,615 | $0 | $0 |
| 2020 | $5,261 | $287,976 | $0 | $0 |
| 2019 | $5,170 | $279,589 | $0 | $0 |
| 2018 | $4,774 | $271,446 | $0 | $0 |
| 2017 | $4,624 | $263,540 | $0 | $0 |
| 2016 | $4,463 | $255,864 | $0 | $0 |
| 2015 | $4,337 | $248,412 | $0 | $0 |
| 2014 | $4,056 | $241,177 | $0 | $0 |
Source: Public Records
Map
Nearby Homes
- 10939 SE Valley Way
- 11092 SE Westchester Ave
- 13931 SE Rolling Meadows Dr
- 11294 SE Westchester Ave
- 14079 SE Alta Vista Dr
- 14121 SE Alta Vista Dr
- 14133 SE Alta Vista Dr
- 13199 SE Gateway Dr
- 14300 SE King Rd
- 13087 SE Gateway Dr
- 11847 SE Waterleaf Dr
- 12989 SE Mountain Gate Rd
- 12027 SE Cicely Ln
- 13733 SE Aldridge Rd
- 12740 SE Gateway Dr
- 11698 SE Verns Way
- 12444 SE Spencer Ct
- 11402 SE Cheerful Way
- 10520 SE Isaac Dr
- 12510 SE Mt Scott Blvd
- 11070 SE Alexander Ave
- 11088 SE Alexander Dr
- 11088 SE Alexander Ave
- 11052 SE Alexander Ave
- 11021 SE Valley Way
- 11021 SE Valley Way
- 11047 SE Valley Way
- 11142 SE Alexander Ave
- 10963 SE Valley Way
- 11034 SE Alexander Ave
- 11034 SE Alexander Dr
- 11061 SE Alexander Ave
- 11047 SE Alexander
- 11047 SE Alexander Ave
- 11095 SE Alexander Ave
- 11065 SE Valley Way
- 11019 SE Alexander
- 11160 SE Alexander Dr
- 11160 SE Alexander
- 11160 SE Alexander Ave