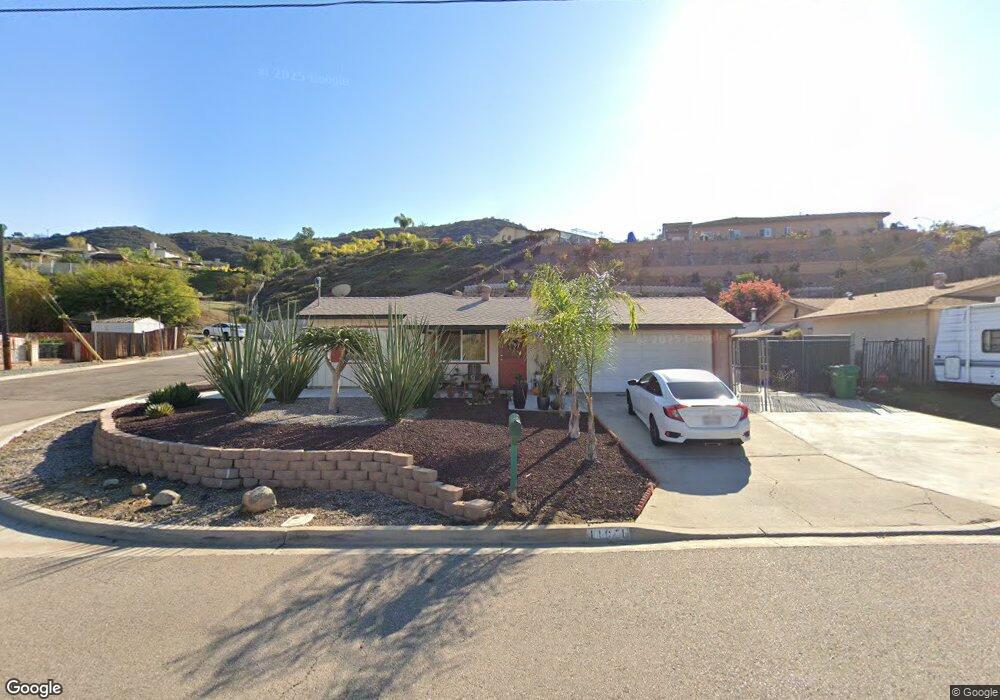
11071 Larkridge St Santee, CA 92071
Estimated Value: $638,000 - $756,000
3
Beds
2
Baths
1,048
Sq Ft
$670/Sq Ft
Est. Value
About This Home
This home is located at 11071 Larkridge St, Santee, CA 92071 and is currently estimated at $702,133, approximately $669 per square foot. 11071 Larkridge St is a home located in San Diego County with nearby schools including Pepper Drive Elementary School, Santana High School, and River Valley Charter School.
Ownership History
Date
Name
Owned For
Owner Type
Purchase Details
Closed on
Oct 15, 2010
Sold by
Smith Jessica J and Smith Raymond L
Bought by
Smith Raymond L and Smith Jessica J
Current Estimated Value
Home Financials for this Owner
Home Financials are based on the most recent Mortgage that was taken out on this home.
Original Mortgage
$193,000
Interest Rate
3.79%
Mortgage Type
New Conventional
Purchase Details
Closed on
Jul 31, 2008
Sold by
Smith Raymond L and Smith Jessica J
Bought by
Smith Raymond L and Smith Jessica J
Purchase Details
Closed on
Aug 26, 2003
Sold by
Smith Raymond L
Bought by
Smith Raymond L and Smith Jessica J
Home Financials for this Owner
Home Financials are based on the most recent Mortgage that was taken out on this home.
Original Mortgage
$210,000
Interest Rate
6.06%
Mortgage Type
Purchase Money Mortgage
Purchase Details
Closed on
May 2, 1995
Sold by
Smith Lloyd Gilbert
Bought by
Trust Of Lloyd Gilbert Smith
Create a Home Valuation Report for This Property
The Home Valuation Report is an in-depth analysis detailing your home's value as well as a comparison with similar homes in the area
Purchase History
| Date | Buyer | Sale Price | Title Company |
|---|---|---|---|
| Smith Raymond L | -- | Accommodation | |
| Smith Jessica J | -- | First American Title Company | |
| Smith Raymond L | -- | None Available | |
| Smith Raymond L | -- | Fidelity National Title | |
| Trust Of Lloyd Gilbert Smith | -- | -- |
Source: Public Records
Mortgage History
| Date | Status | Borrower | Loan Amount |
|---|---|---|---|
| Closed | Smith Jessica J | $193,000 | |
| Closed | Smith Raymond L | $210,000 |
Source: Public Records
Tax History
| Year | Tax Paid | Tax Assessment Tax Assessment Total Assessment is a certain percentage of the fair market value that is determined by local assessors to be the total taxable value of land and additions on the property. | Land | Improvement |
|---|---|---|---|---|
| 2025 | $678 | $44,525 | $13,600 | $30,925 |
| 2024 | $678 | $43,653 | $13,334 | $30,319 |
| 2023 | $657 | $42,798 | $13,073 | $29,725 |
| 2022 | $648 | $41,960 | $12,817 | $29,143 |
| 2021 | $637 | $41,138 | $12,566 | $28,572 |
| 2020 | $630 | $40,718 | $12,438 | $28,280 |
| 2019 | $612 | $39,921 | $12,195 | $27,726 |
| 2018 | $600 | $39,139 | $11,956 | $27,183 |
| 2017 | $160 | $38,372 | $11,722 | $26,650 |
| 2016 | $574 | $37,621 | $11,493 | $26,128 |
| 2015 | $568 | $37,057 | $11,321 | $25,736 |
| 2014 | $558 | $36,332 | $11,100 | $25,232 |
Source: Public Records
Map
Nearby Homes
- 11038 Larkridge St
- 9241 Bloomdale St
- 1018 Iron Wheel St
- 1507 Calabria St
- 2003 Montilla St
- 5276 Bella Vista St
- 9070 Paradise Park Dr
- 9103 Paradise Park Dr
- 11529 Woodside Ave
- 10794 Jeanne Terrace Unit E
- 10794 Jeanne Terrace Unit D
- 6081 Cala Lily St
- 9728 Marilla Dr Unit 805
- 10727 Holly Meadows Dr
- 11656 Green Ln
- 8970 Winter Gardens Blvd Unit B
- 8968 Winter Gardens Blvd Unit 4
- 10664 Cobble Ct
- 10671 Braverman Dr
- 8712 N Magnolia Ave Unit 262
- 11067 Larkridge St
- 11063 Larkridge St
- 11105 Larkridge St
- 9058 Aubert Way
- 8806 Diamondback Dr
- 11059 Larkridge St
- 11062 Larkridge St
- 8812 Diamondback Dr
- 11109 Larkridge St
- 11104 Larkridge St
- 9106 Heatherdale St
- 11055 Larkridge St
- 11058 Larkridge St
- 11113 Larkridge St
- 9110 Heatherdale St
- 11108 Larkridge St
- 9002 Silver Ct
- 11054 Larkridge St
- 11051 Larkridge St
- 9114 Heatherdale St
Your Personal Tour Guide
Ask me questions while you tour the home.