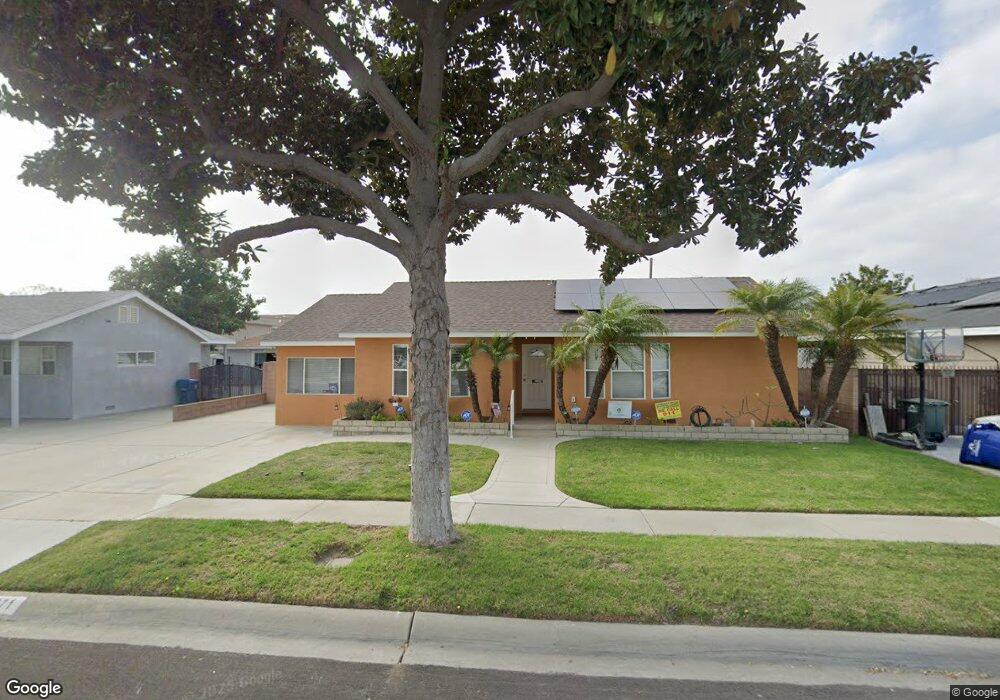
11071 Midway Dr Los Alamitos, CA 90720
Estimated Value: $1,089,000 - $1,240,000
2
Beds
3
Baths
1,400
Sq Ft
$819/Sq Ft
Est. Value
About This Home
This home is located at 11071 Midway Dr, Los Alamitos, CA 90720 and is currently estimated at $1,146,528, approximately $818 per square foot. 11071 Midway Dr is a home located in Orange County with nearby schools including Los Alamitos Elementary School, Jack L. Weaver Elementary School, and Sharon Christa Mcauliffe Middle School.
Ownership History
Date
Name
Owned For
Owner Type
Purchase Details
Closed on
Apr 30, 2014
Sold by
Kent Debra Minor
Bought by
Dminor Kent Living Trust
Current Estimated Value
Purchase Details
Closed on
Apr 30, 2004
Sold by
Kent Wallace Karl and Kent Debra Minor
Bought by
Kent Debra Minor
Home Financials for this Owner
Home Financials are based on the most recent Mortgage that was taken out on this home.
Original Mortgage
$75,000
Interest Rate
5.38%
Mortgage Type
New Conventional
Purchase Details
Closed on
Sep 19, 1996
Sold by
Kent Wanda Joyce
Bought by
Kent Wallace Karl
Purchase Details
Closed on
Aug 31, 1995
Sold by
Kent Wallace K
Bought by
Kent Wallace K and Kent Debra Minor
Purchase Details
Closed on
Apr 14, 1978
Sold by
Mehren Joel P and Mehren Martha L
Bought by
Kent David L and Kent Wallace K
Create a Home Valuation Report for This Property
The Home Valuation Report is an in-depth analysis detailing your home's value as well as a comparison with similar homes in the area
Home Values in the Area
Average Home Value in this Area
Purchase History
| Date | Buyer | Sale Price | Title Company |
|---|---|---|---|
| Dminor Kent Living Trust | -- | None Available | |
| Kent Debra Minor | -- | United Title Company | |
| Kent Wallace Karl | -- | Continental Lawyers Title Co | |
| Kent Wallace K | -- | -- | |
| Kent David L | -- | -- |
Source: Public Records
Mortgage History
| Date | Status | Borrower | Loan Amount |
|---|---|---|---|
| Closed | Kent Debra Minor | $75,000 |
Source: Public Records
Tax History Compared to Growth
Tax History
| Year | Tax Paid | Tax Assessment Tax Assessment Total Assessment is a certain percentage of the fair market value that is determined by local assessors to be the total taxable value of land and additions on the property. | Land | Improvement |
|---|---|---|---|---|
| 2025 | $5,652 | $470,028 | $338,573 | $131,455 |
| 2024 | $5,652 | $460,812 | $331,934 | $128,878 |
| 2023 | $5,518 | $451,777 | $325,426 | $126,351 |
| 2022 | $4,966 | $396,019 | $319,045 | $76,974 |
| 2021 | $4,856 | $388,254 | $312,789 | $75,465 |
| 2020 | $4,864 | $384,273 | $309,581 | $74,692 |
| 2019 | $4,692 | $376,739 | $303,511 | $73,228 |
| 2018 | $4,470 | $369,352 | $297,559 | $71,793 |
| 2017 | $4,373 | $362,110 | $291,724 | $70,386 |
| 2016 | $4,287 | $355,010 | $286,004 | $69,006 |
| 2015 | $4,234 | $349,678 | $281,708 | $67,970 |
| 2014 | $4,087 | $342,829 | $276,190 | $66,639 |
Source: Public Records
Map
Nearby Homes
- 11091 Ranger Dr
- 4411 Farquhar Ave
- 4311 Howard Ave
- 5092 Citation Ave
- 10424 Santa Rita St
- 3845 Farquhar Ave Unit 110
- 3845 Farquhar Ave
- 10191 Virgil Cir
- 3802 Howard Ave
- 5041 Myra Ave
- 3804 Howard Ave
- 4777 Larwin Ave
- 4418 Larwin Ave
- 11344 Rochelle St
- 5633 Lakia Dr
- 4481 Larwin Ave
- 10202 Aqueduct Dr
- 4177 Elizabeth Ct
- 11676 Lakia Dr
- 3701 La Colmena Way
- 11061 Midway Dr
- 11081 Midway Dr
- 11072 Enterprise Dr
- 4702 Green Ave
- 11082 Enterprise Dr
- 11101 Midway Dr
- 11072 Midway Dr
- 11092 Enterprise Dr
- 4752 Green Ave
- 11082 Midway Dr
- 11111 Midway Dr
- 11102 Midway Dr
- 11102 Enterprise Dr
- 4751 Green Ave
- 11112 Midway Dr
- 11121 Midway Dr
- 11061 Ticonderoga Dr
- 11081 Ticonderoga Dr
- 11071 Enterprise Dr
- 4682 Green Ave