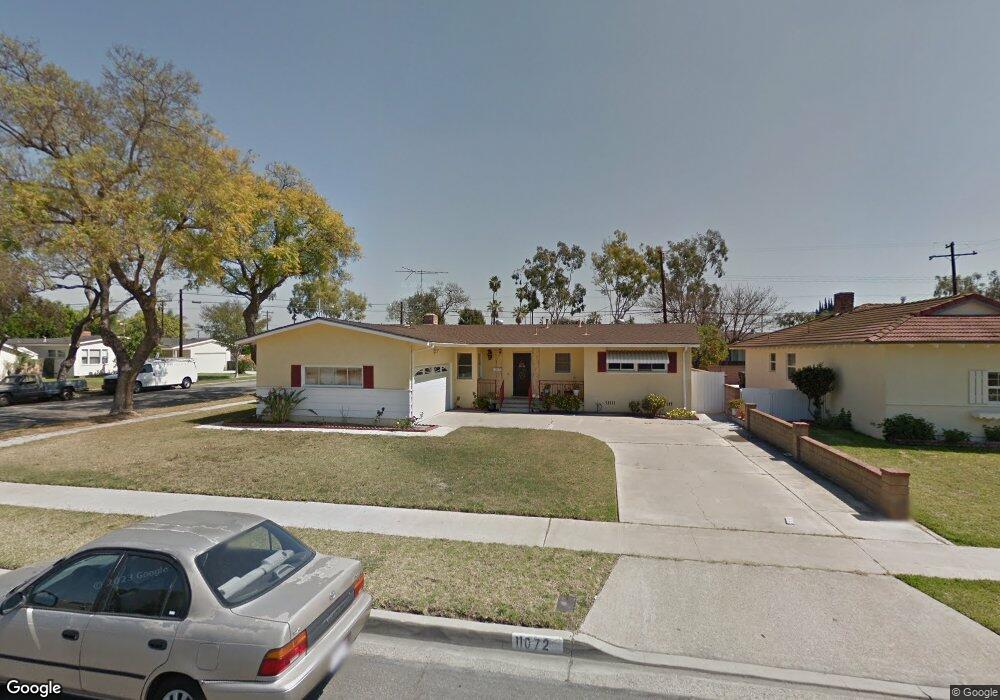
11072 Harcourt Ave Garden Grove, CA 92841
Estimated Value: $977,000 - $1,037,000
3
Beds
2
Baths
1,473
Sq Ft
$680/Sq Ft
Est. Value
About This Home
This home is located at 11072 Harcourt Ave, Garden Grove, CA 92841 and is currently estimated at $1,001,606, approximately $679 per square foot. 11072 Harcourt Ave is a home located in Orange County with nearby schools including Gilbert Elementary School, Lake Intermediate School, and Rancho Alamitos High School.
Ownership History
Date
Name
Owned For
Owner Type
Purchase Details
Closed on
Jul 15, 2015
Sold by
Vo Luyen N and Pham Thuylien T
Bought by
Vo Luyen Ngoc and Revoca Thi Pham Revoca
Current Estimated Value
Purchase Details
Closed on
Sep 24, 2010
Sold by
Pham Thuylien T and Vo Luyen N
Bought by
Vo Luyen N and Pham Thuylien T
Home Financials for this Owner
Home Financials are based on the most recent Mortgage that was taken out on this home.
Original Mortgage
$200,000
Outstanding Balance
$131,327
Interest Rate
4.33%
Mortgage Type
New Conventional
Estimated Equity
$870,279
Purchase Details
Closed on
Jul 1, 2003
Sold by
Alexander David Anthony
Bought by
Pham Thuylien T and Vo Luyen N
Home Financials for this Owner
Home Financials are based on the most recent Mortgage that was taken out on this home.
Original Mortgage
$285,000
Interest Rate
5.13%
Mortgage Type
Purchase Money Mortgage
Purchase Details
Closed on
Aug 16, 2002
Sold by
Alexander Ernestine B
Bought by
Alexander David Anthony
Create a Home Valuation Report for This Property
The Home Valuation Report is an in-depth analysis detailing your home's value as well as a comparison with similar homes in the area
Home Values in the Area
Average Home Value in this Area
Purchase History
| Date | Buyer | Sale Price | Title Company |
|---|---|---|---|
| Vo Luyen Ngoc | -- | None Available | |
| Vo Luyen N | -- | Lawyers Title | |
| Pham Thuylien T | $360,000 | -- | |
| Alexander David Anthony | -- | -- |
Source: Public Records
Mortgage History
| Date | Status | Borrower | Loan Amount |
|---|---|---|---|
| Open | Vo Luyen N | $200,000 | |
| Closed | Pham Thuylien T | $285,000 |
Source: Public Records
Tax History Compared to Growth
Tax History
| Year | Tax Paid | Tax Assessment Tax Assessment Total Assessment is a certain percentage of the fair market value that is determined by local assessors to be the total taxable value of land and additions on the property. | Land | Improvement |
|---|---|---|---|---|
| 2025 | $6,147 | $499,947 | $408,407 | $91,540 |
| 2024 | $6,147 | $490,145 | $400,399 | $89,746 |
| 2023 | $6,033 | $480,535 | $392,548 | $87,987 |
| 2022 | $5,943 | $471,113 | $384,851 | $86,262 |
| 2021 | $5,885 | $461,876 | $377,305 | $84,571 |
| 2020 | $5,818 | $457,141 | $373,437 | $83,704 |
| 2019 | $5,675 | $448,178 | $366,115 | $82,063 |
| 2018 | $5,583 | $439,391 | $358,937 | $80,454 |
| 2017 | $5,507 | $430,776 | $351,899 | $78,877 |
| 2016 | $5,233 | $422,330 | $344,999 | $77,331 |
| 2015 | $5,281 | $425,756 | $339,817 | $85,939 |
| 2014 | $5,101 | $417,417 | $333,161 | $84,256 |
Source: Public Records
Map
Nearby Homes
- 9592 Katella Ave
- 9552 Dewey Dr
- 11172 Homeway Dr
- 9262 Joyzelle Dr
- 9762 Gamble Ave
- 90093 Stacie Ln
- 11432 Pollard Dr
- 11222 Magnolia St
- 9751 Oma Place
- 11421 Barclay Dr
- 9881 Aldgate Ave
- 8971 Poinsettia Ln
- 9041 Stacie Ln Unit 12
- 1765 S Biscayne Ct
- 9155 Pacific Ave Unit 265
- 9272 Cerritos Ave
- 9041 Shelley Dr
- 10112 Becca Dr
- 9901 Royal Palm Blvd
- 1737 S Garden Dr
- 11092 Harcourt Ave
- 11071 Gilbert St
- 11091 Gilbert St
- 11132 Harcourt Ave
- 9431 Maureen Dr
- 9412 Maureen Dr
- 9451 Maureen Dr
- 9421 Maureen Dr
- 9421 Melba Dr
- 11111 Gilbert St
- 9471 Maureen Dr
- 9401 Maureen Dr
- 11152 Harcourt Ave
- 9392 Maureen Dr
- 9432 Meridian Ln
- 9424 Meridian Ln
- 9401 Melba Dr
- 11151 Gilbert St
- 9418 Meridian Ln
- 9391 Maureen Dr