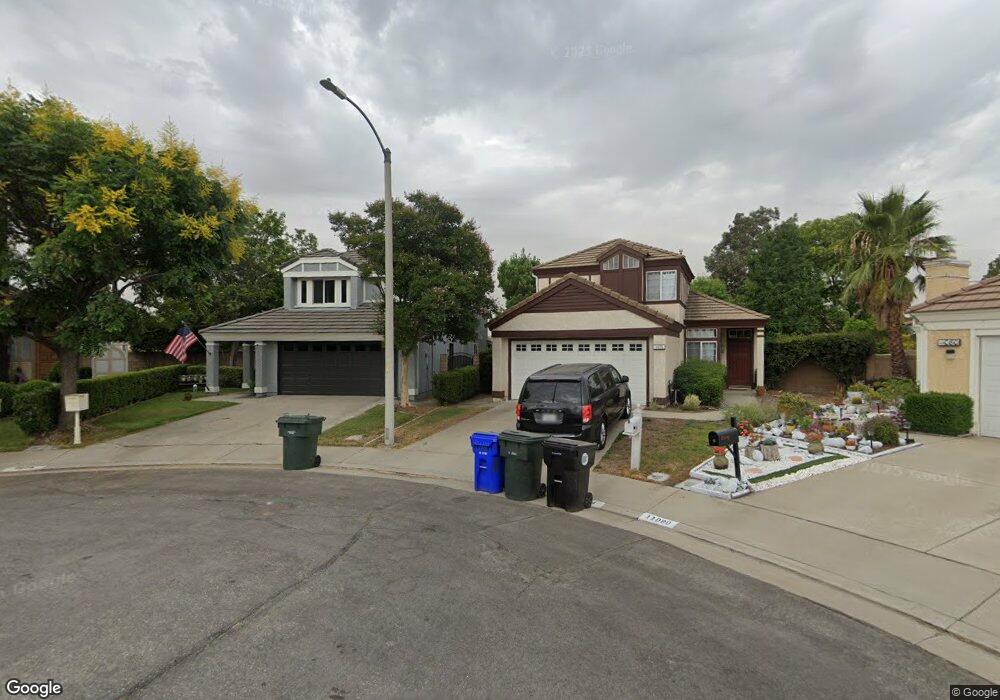
11079 Cloverdale Ct Rancho Cucamonga, CA 91730
Terra Vista NeighborhoodEstimated Value: $720,000 - $791,000
3
Beds
3
Baths
1,957
Sq Ft
$388/Sq Ft
Est. Value
About This Home
This home is located at 11079 Cloverdale Ct, Rancho Cucamonga, CA 91730 and is currently estimated at $760,159, approximately $388 per square foot. 11079 Cloverdale Ct is a home located in San Bernardino County with nearby schools including Ruth Musser Middle, Coyote Canyon Elementary, and Rancho Cucamonga High School.
Ownership History
Date
Name
Owned For
Owner Type
Purchase Details
Closed on
Nov 16, 2010
Sold by
Clark Steven M
Bought by
Clark Steven M
Current Estimated Value
Home Financials for this Owner
Home Financials are based on the most recent Mortgage that was taken out on this home.
Original Mortgage
$288,500
Outstanding Balance
$189,278
Interest Rate
4.16%
Mortgage Type
New Conventional
Estimated Equity
$570,881
Purchase Details
Closed on
Aug 30, 2004
Sold by
Clark Dawn J
Bought by
Clark Steven M
Home Financials for this Owner
Home Financials are based on the most recent Mortgage that was taken out on this home.
Original Mortgage
$311,000
Interest Rate
5.8%
Mortgage Type
New Conventional
Purchase Details
Closed on
Oct 23, 2000
Sold by
Collins Joseph G
Bought by
Clark Steven M and Clark Dawn J
Home Financials for this Owner
Home Financials are based on the most recent Mortgage that was taken out on this home.
Original Mortgage
$161,500
Interest Rate
7.86%
Create a Home Valuation Report for This Property
The Home Valuation Report is an in-depth analysis detailing your home's value as well as a comparison with similar homes in the area
Home Values in the Area
Average Home Value in this Area
Purchase History
| Date | Buyer | Sale Price | Title Company |
|---|---|---|---|
| Clark Steven M | -- | Lsi | |
| Clark Steven M | -- | United Title | |
| Clark Steven M | $212,000 | First American Title Ins Co |
Source: Public Records
Mortgage History
| Date | Status | Borrower | Loan Amount |
|---|---|---|---|
| Open | Clark Steven M | $288,500 | |
| Closed | Clark Steven M | $311,000 | |
| Closed | Clark Steven M | $161,500 |
Source: Public Records
Tax History Compared to Growth
Tax History
| Year | Tax Paid | Tax Assessment Tax Assessment Total Assessment is a certain percentage of the fair market value that is determined by local assessors to be the total taxable value of land and additions on the property. | Land | Improvement |
|---|---|---|---|---|
| 2025 | $4,031 | $319,454 | $79,863 | $239,591 |
| 2024 | $4,031 | $313,190 | $78,297 | $234,893 |
| 2023 | $3,924 | $307,049 | $76,762 | $230,287 |
| 2022 | $3,839 | $301,029 | $75,257 | $225,772 |
| 2021 | $3,837 | $295,126 | $73,781 | $221,345 |
| 2020 | $3,743 | $292,099 | $73,024 | $219,075 |
| 2019 | $3,727 | $286,371 | $71,592 | $214,779 |
| 2018 | $3,637 | $280,756 | $70,188 | $210,568 |
| 2017 | $3,580 | $275,251 | $68,812 | $206,439 |
| 2016 | $3,564 | $269,854 | $67,463 | $202,391 |
| 2015 | $3,521 | $265,801 | $66,450 | $199,351 |
| 2014 | $3,425 | $260,594 | $65,148 | $195,446 |
Source: Public Records
Map
Nearby Homes
- 11090 Mountain View Dr Unit 53
- 7636 Belvedere Place
- 7522 Calais Ct
- 7759 Devonshire Ct
- 7668 Belpine Place
- 11261 Terra Vista Pkwy
- 11213 Terra Vista Pkwy Unit D
- 11318 Fitzpatrick Dr
- 7331 Belpine Place Unit 31
- 11450 Church St Unit 167
- 7803 Paxton Place
- 10627 Wildrose Dr
- 10591 Huxley Dr
- 7718 Haywood Place
- 7224 Parkside Place
- 7271 Venosa Place
- 7235 Venosa Place
- 10487 Balsa St
- 7314 Greenhaven Ave Unit 74
- 7179 Summerfield Place
- 11085 Cloverdale Ct
- 11074 Cloverdale Ct
- 11089 Cloverdale Ct
- 11076 Brentwood Dr
- 11070 Brentwood Dr
- 11080 Cloverdale Ct
- 11063 Hastings Ct
- 11082 Brentwood Dr
- 11058 Hastings Ct
- 11095 Cloverdale Ct
- 11086 Cloverdale Ct
- 11055 Hastings Ct
- 11088 Brentwood Dr
- 11052 Hastings Ct
- 11092 Cloverdale Ct
- 11099 Cloverdale Ct
- 11094 Brentwood Dr
- 11047 Hastings Ct
- 11046 Hastings Ct
- 11098 Cloverdale Ct