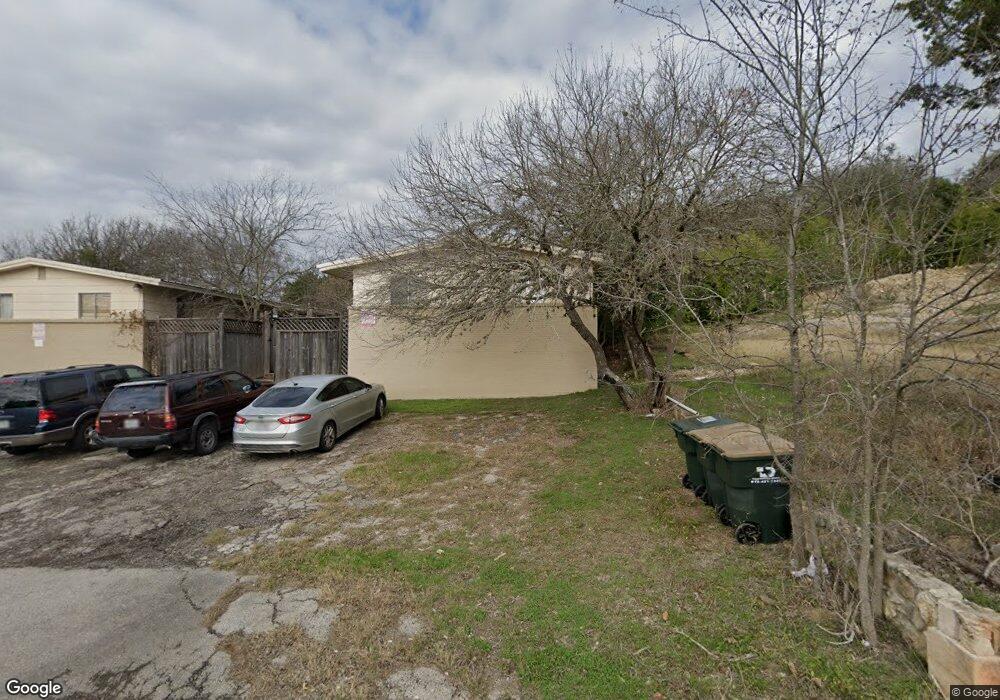
1108 Advance St Unit 10 San Marcos, TX 78666
Southwest Hills NeighborhoodEstimated Value: $253,725 - $369,000
--
Bed
--
Bath
1,575
Sq Ft
$209/Sq Ft
Est. Value
About This Home
This home is located at 1108 Advance St Unit 10, San Marcos, TX 78666 and is currently estimated at $328,431, approximately $208 per square foot. 1108 Advance St Unit 10 is a home located in Hays County with nearby schools including Crockett Elementary School, Dorris Miller Middle School, and San Marcos High School.
Ownership History
Date
Name
Owned For
Owner Type
Purchase Details
Closed on
Mar 27, 2015
Sold by
Omais Youssef R
Bought by
Omais Investments Llc
Current Estimated Value
Purchase Details
Closed on
Aug 21, 2013
Sold by
Watermen Investments Llc
Bought by
Omais Investments Llc
Purchase Details
Closed on
Mar 20, 2011
Sold by
Miami Rental Search Llc
Bought by
Watermen Investments Llc
Home Financials for this Owner
Home Financials are based on the most recent Mortgage that was taken out on this home.
Original Mortgage
$88,832
Interest Rate
5.06%
Mortgage Type
Seller Take Back
Purchase Details
Closed on
Mar 14, 2011
Sold by
Mizuno Hiromichi and Mizuno Yukiyo
Bought by
Miami Rental Search Llc
Home Financials for this Owner
Home Financials are based on the most recent Mortgage that was taken out on this home.
Original Mortgage
$88,832
Interest Rate
5.06%
Mortgage Type
Seller Take Back
Create a Home Valuation Report for This Property
The Home Valuation Report is an in-depth analysis detailing your home's value as well as a comparison with similar homes in the area
Home Values in the Area
Average Home Value in this Area
Purchase History
| Date | Buyer | Sale Price | Title Company |
|---|---|---|---|
| Omais Investments Llc | -- | -- | |
| Omais Investments Llc | -- | -- | |
| Watermen Investments Llc | -- | Chicago Title Insurance Co | |
| Miami Rental Search Llc | -- | None Available |
Source: Public Records
Mortgage History
| Date | Status | Borrower | Loan Amount |
|---|---|---|---|
| Previous Owner | Watermen Investments Llc | $88,832 | |
| Previous Owner | Miami Rental Search Llc | $88,832 |
Source: Public Records
Tax History Compared to Growth
Tax History
| Year | Tax Paid | Tax Assessment Tax Assessment Total Assessment is a certain percentage of the fair market value that is determined by local assessors to be the total taxable value of land and additions on the property. | Land | Improvement |
|---|---|---|---|---|
| 2025 | $5,416 | $214,624 | $16,740 | $197,884 |
| 2024 | $5,416 | $275,194 | $16,740 | $258,454 |
| 2023 | $4,660 | $245,000 | $16,740 | $228,260 |
| 2022 | $5,129 | $250,279 | $14,190 | $236,089 |
| 2021 | $4,513 | $204,737 | $14,190 | $190,547 |
| 2020 | $3,967 | $180,000 | $14,190 | $165,810 |
| 2019 | $3,989 | $162,025 | $14,190 | $147,835 |
| 2018 | $3,009 | $121,670 | $14,190 | $107,480 |
| 2017 | $2,925 | $121,670 | $14,190 | $107,480 |
| 2016 | $2,807 | $116,760 | $14,190 | $102,570 |
| 2015 | $2,818 | $116,760 | $14,190 | $102,570 |
Source: Public Records
Map
Nearby Homes
- 1108/1110 Advance St
- 1110 Advance St
- 1112 Advance St Unit 14
- 1104 Advance St
- 1102 Advance St
- 1102-1104 Advance St
- 1116 Advance St Unit 18
- 1103 Hillyer St
- 1103 Hillyer St Unit B
- 1103 Hillyer St Unit A&B
- 1105 Hillyer St
- 1120/1122 Advance St
- 1120 Advance St Unit 22
- 811 Furman Ave
- 810 & 814 Allen St
- 810 Allen St Unit 14
- 1107 Advance St
- 1111 Advance St
- 1109 Advance St Unit 1111