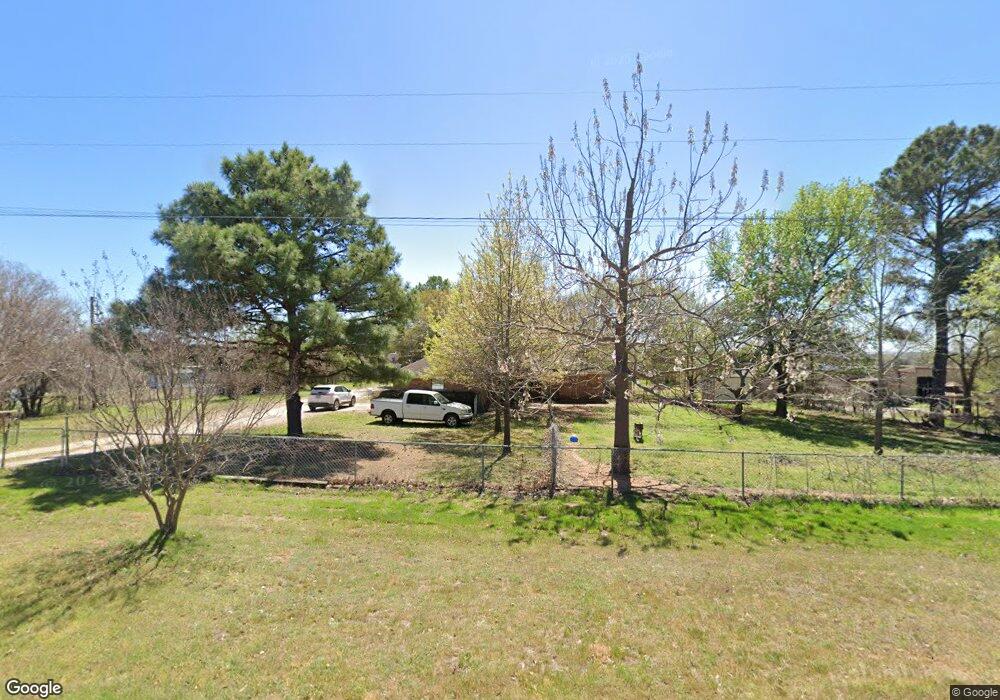
1108 County Road 701 Cleburne, TX 76031
Estimated Value: $411,000 - $451,000
3
Beds
2
Baths
2,166
Sq Ft
$197/Sq Ft
Est. Value
About This Home
This home is located at 1108 County Road 701, Cleburne, TX 76031 and is currently estimated at $425,658, approximately $196 per square foot. 1108 County Road 701 is a home located in Johnson County with nearby schools including Plum Creek Elementary School, Joshua High School - 9th Grade Campus, and Joshua High School.
Ownership History
Date
Name
Owned For
Owner Type
Purchase Details
Closed on
Jul 6, 2018
Sold by
Ven Ken Inc
Bought by
Witt Larry V and Witt Rosie F
Current Estimated Value
Home Financials for this Owner
Home Financials are based on the most recent Mortgage that was taken out on this home.
Original Mortgage
$21,500
Interest Rate
4.6%
Mortgage Type
Purchase Money Mortgage
Purchase Details
Closed on
Jan 16, 2013
Sold by
Hanes Jorgensen Burgdorf Limited
Bought by
Witt Rosie F
Purchase Details
Closed on
Dec 5, 2012
Sold by
Us Bank Na
Bought by
Hanes Jorgensen & Burgdorf Ltd
Purchase Details
Closed on
Apr 21, 2006
Sold by
Settle Jimmy
Bought by
Us Bank Na
Home Financials for this Owner
Home Financials are based on the most recent Mortgage that was taken out on this home.
Original Mortgage
$141,600
Interest Rate
7.85%
Mortgage Type
Purchase Money Mortgage
Create a Home Valuation Report for This Property
The Home Valuation Report is an in-depth analysis detailing your home's value as well as a comparison with similar homes in the area
Home Values in the Area
Average Home Value in this Area
Purchase History
| Date | Buyer | Sale Price | Title Company |
|---|---|---|---|
| Witt Larry V | -- | Providence Title Co | |
| Witt Rosie F | -- | -- | |
| Hanes Jorgensen & Burgdorf Ltd | -- | None Available | |
| Us Bank Na | $122,995 | None Available | |
| Settle Jimmy | -- | Stnt |
Source: Public Records
Mortgage History
| Date | Status | Borrower | Loan Amount |
|---|---|---|---|
| Closed | Witt Larry V | $21,500 | |
| Previous Owner | Settle Jimmy | $141,600 |
Source: Public Records
Tax History Compared to Growth
Tax History
| Year | Tax Paid | Tax Assessment Tax Assessment Total Assessment is a certain percentage of the fair market value that is determined by local assessors to be the total taxable value of land and additions on the property. | Land | Improvement |
|---|---|---|---|---|
| 2025 | $619 | $418,914 | $213,350 | $205,564 |
| 2024 | $3,495 | $200,358 | $0 | $0 |
| 2023 | $603 | $313,648 | $163,150 | $150,498 |
| 2022 | $2,977 | $263,482 | $163,150 | $100,332 |
| 2021 | $2,740 | $150,532 | $50,200 | $100,332 |
| 2020 | $2,969 | $150,532 | $50,200 | $100,332 |
| 2019 | $3,139 | $150,532 | $50,200 | $100,332 |
| 2018 | $2,962 | $135,786 | $50,200 | $85,586 |
| 2017 | $2,930 | $135,786 | $50,200 | $85,586 |
| 2016 | $2,664 | $122,196 | $36,610 | $85,586 |
| 2015 | $1,957 | $122,196 | $36,610 | $85,586 |
| 2014 | $1,957 | $122,196 | $36,610 | $85,586 |
Source: Public Records
Map
Nearby Homes
- 1015 County Road 701
- 1204 Honeysuckle Dr
- 2591 Hopewell Rd
- 1941 Autumn Ln
- 1009 Ben Dr
- 1945 Autumn Ln
- 1949 Autumn Ln
- Ramsey Plan at Ashton Homeplace
- Oxford Plan at Ashton Homeplace
- Newlin Plan at Ashton Homeplace
- Beckman Plan at Ashton Homeplace
- Lot 1 County Road 805
- Lot 5 County Road 805
- 601 County Road 805
- Lot 2 County Road 805
- Lot 6 County Road 805
- Lot 3 County Road 805
- Lot 4 County Road 805
- 2308 Chickering Rd
- 696 Prestonwood Ln
- 1104 County Road 701
- 1100 County Road 701
- 1113 County Road 701
- 2000 Tepar Ln
- 2008 Tepar Ln
- 1029 County Road 701
- 1121 County Road 701
- 2009 Tepar Ln
- 2012 Tepar Ln
- 1124 County Road 701
- 1024 County Road 701
- 2308 County Road 801b
- 2017 Tepar Ln
- 1012 County Road 701
- 2019 Tepar Ln
- 1009 County Road 701
- 1202 Cr 701
- 1202 County Road 701
- 1214 Honeysuckle Dr
- 2025 Tepar Ln