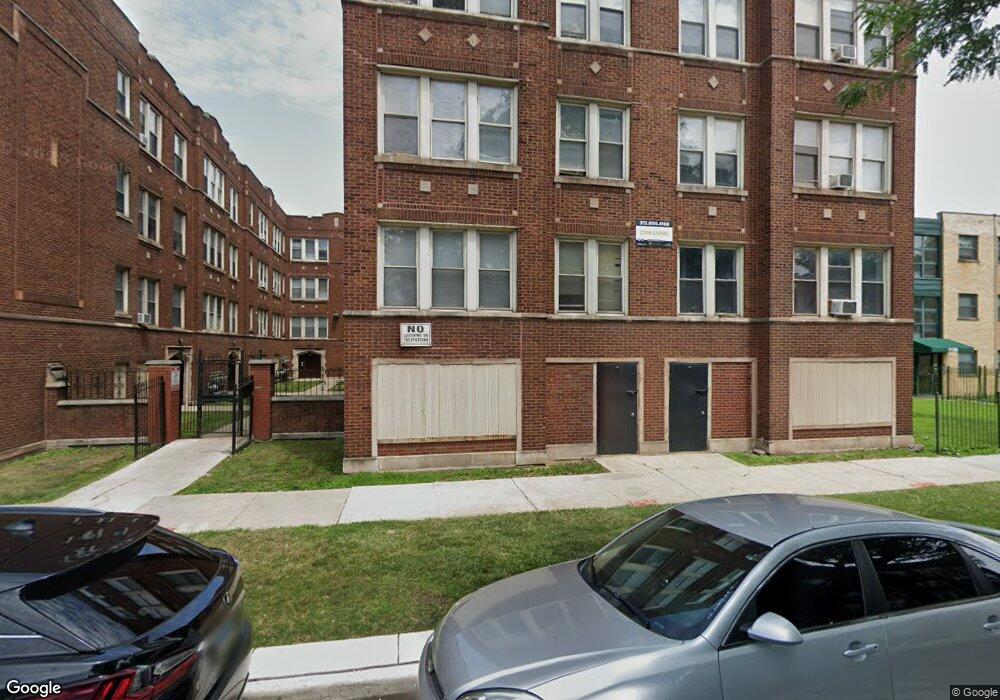
1108 E 82nd St Chicago, IL 60619
Grand Crossing Neighborhood
2
Beds
--
Bath
775
Sq Ft
--
Built
About This Home
1108 E 82nd Street on Chicago's South Side in the Chatham Area near E 82nd St and S Cottage Grove Ave! This 36 unit property features great amenities. Convenient public transit easily accessible via ME Metra Electric, CTA Red line as well as 79th and 4 Cottage Grove bus lines. Call now to schedule a tour with CYM Living!
Create a Home Valuation Report for This Property
The Home Valuation Report is an in-depth analysis detailing your home's value as well as a comparison with similar homes in the area
Home Values in the Area
Average Home Value in this Area
Property History
| Date | Event | Price | List to Sale | Price per Sq Ft |
|---|---|---|---|---|
| 12/05/2023 12/05/23 | Price Changed | $775 | -1.9% | $1 / Sq Ft |
| 11/29/2023 11/29/23 | For Rent | $790 | -- | -- |
Tax History
| Year | Tax Paid | Tax Assessment Tax Assessment Total Assessment is a certain percentage of the fair market value that is determined by local assessors to be the total taxable value of land and additions on the property. | Land | Improvement |
|---|---|---|---|---|
| 2025 | $29,798 | $203,029 | $16,941 | $186,088 |
| 2024 | $29,798 | $203,029 | $16,941 | $186,088 |
| 2023 | $29,048 | $141,229 | $12,198 | $129,031 |
| 2022 | $29,048 | $141,229 | $12,198 | $129,031 |
| 2021 | $28,399 | $141,227 | $12,197 | $129,030 |
| 2020 | $29,838 | $133,942 | $12,197 | $121,745 |
| 2019 | $26,911 | $133,942 | $12,197 | $121,745 |
| 2018 | $26,458 | $133,942 | $12,197 | $121,745 |
| 2017 | $26,062 | $121,068 | $10,164 | $110,904 |
| 2016 | $24,249 | $121,068 | $10,164 | $110,904 |
| 2015 | $22,185 | $121,068 | $10,164 | $110,904 |
| 2014 | $17,630 | $95,020 | $10,164 | $84,856 |
| 2013 | $6,476 | $35,608 | $10,164 | $25,444 |
Source: Public Records
Map
Nearby Homes
- 1122 E 81st Place
- 1129 E 81st St
- 1121 E 82nd Place
- 1117 E 82nd Place
- 1125 E 82nd Place
- 8036 S Dobson Ave
- 8048 S Avalon Ave
- 8227 S Avalon Ave
- 8133 S Ingleside Ave
- 8026 S Dobson Ave
- 8219 S Ingleside Ave
- 8101 S Kimbark Ave
- 8139 S Drexel Ave
- 8016 S Kimbark Ave
- 8018 S Kimbark Ave
- 8136 S Drexel Ave Unit 3
- 8226 S Drexel Ave
- 7928 S Dobson Ave
- 7944 S Ellis Ave
- 8239 S Kenwood Ave
- 1117 E 81st Place
- 1121 E 81st Place
- 1128 E 82nd St
- 1123 E 81st Place
- 1125 E 81st Place
- 1113 E 82nd St
- 1117 E 82nd St
- 1119 E 82nd St
- 1121 E 82nd St Unit 23
- 1133 E 81st Place
- 1133 E 81st Place
- 1133 E 81st Place Unit 2
- 1135 E 81st Place
- 1112 E 81st Place
- 1141 E 81st Place
- 1133 E 82nd St
- 1116 E 81st Place
- 1137 E 82nd St
- 1120 E 81st Place
- 1143 E 81st Place
Your Personal Tour Guide
Ask me questions while you tour the home.