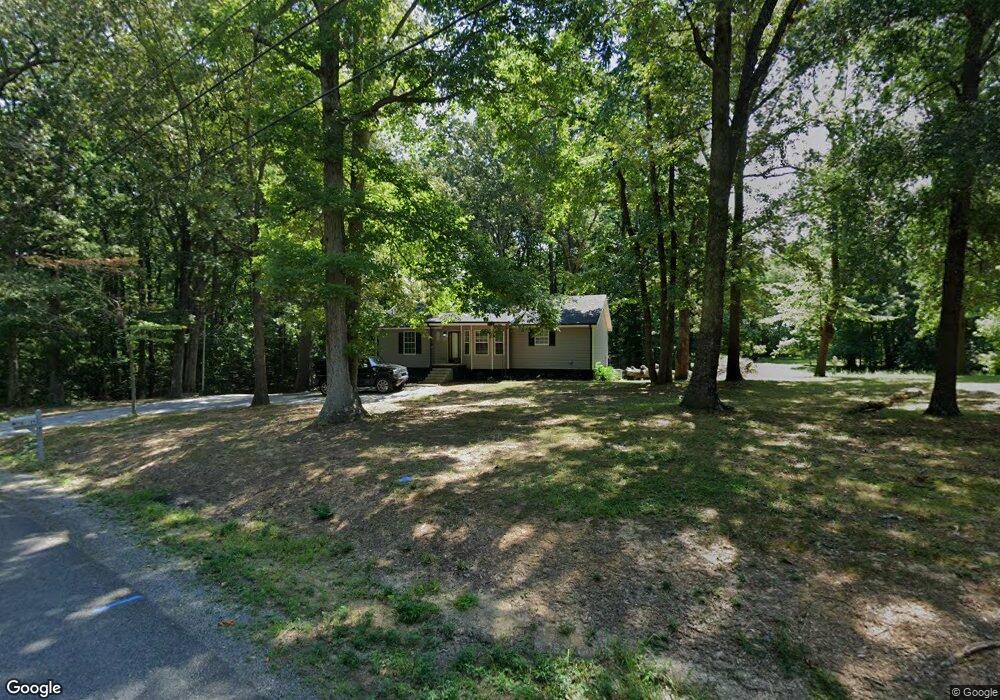
1108 Ellis Ct Chapmansboro, TN 37035
Estimated Value: $319,000 - $381,000
--
Bed
2
Baths
1,258
Sq Ft
$268/Sq Ft
Est. Value
About This Home
This home is located at 1108 Ellis Ct, Chapmansboro, TN 37035 and is currently estimated at $337,488, approximately $268 per square foot. 1108 Ellis Ct is a home located in Cheatham County with nearby schools including Pleasant View Elementary School, Sycamore Middle School, and Sycamore High School.
Ownership History
Date
Name
Owned For
Owner Type
Purchase Details
Closed on
May 18, 2010
Sold by
Short Caleb
Bought by
Anderson Douglas James
Current Estimated Value
Purchase Details
Closed on
Jul 10, 2009
Sold by
Short Donna A
Bought by
Short Caleb
Purchase Details
Closed on
Jan 21, 2000
Bought by
Short Donna A
Purchase Details
Closed on
Jul 30, 1987
Bought by
Short Gary L and Short Donna
Create a Home Valuation Report for This Property
The Home Valuation Report is an in-depth analysis detailing your home's value as well as a comparison with similar homes in the area
Home Values in the Area
Average Home Value in this Area
Purchase History
| Date | Buyer | Sale Price | Title Company |
|---|---|---|---|
| Anderson Douglas James | $75,000 | -- | |
| Short Caleb | $96,349 | -- | |
| Short Donna A | $9,821 | -- | |
| Short Gary L | $64,500 | -- |
Source: Public Records
Tax History Compared to Growth
Tax History
| Year | Tax Paid | Tax Assessment Tax Assessment Total Assessment is a certain percentage of the fair market value that is determined by local assessors to be the total taxable value of land and additions on the property. | Land | Improvement |
|---|---|---|---|---|
| 2024 | $1,349 | $77,925 | $17,875 | $60,050 |
| 2023 | $1,147 | $42,600 | $4,400 | $38,200 |
| 2022 | $1,147 | $42,600 | $4,400 | $38,200 |
| 2021 | $1,147 | $42,600 | $4,400 | $38,200 |
| 2020 | $1,147 | $42,600 | $4,400 | $38,200 |
| 2019 | $1,147 | $42,600 | $4,400 | $38,200 |
| 2018 | $1,015 | $32,350 | $3,200 | $29,150 |
| 2017 | $960 | $32,350 | $3,200 | $29,150 |
| 2016 | $913 | $32,350 | $3,200 | $29,150 |
| 2015 | $823 | $27,250 | $3,200 | $24,050 |
| 2014 | $823 | $27,250 | $3,200 | $24,050 |
Source: Public Records
Map
Nearby Homes
- 1136 Dimple Rd
- 2220 Pleasant View Rd
- 0 Keystone Dr
- 1016 Keystone Dr
- Crocker III H Plan at Highland Reserves - The Estates
- Adams IV G Plan at Highland Reserves - The Estates
- Hudson Plan at Highland Reserves
- Harding Plan at Highland Reserves
- Calderwood Plan at Highland Reserves
- Camphor III H Plan at Highland Reserves - The Estates
- Charlotte III H Plan at Highland Reserves - The Estates
- Charlotte III G Plan at Highland Reserves - The Estates
- Camphor III G Plan at Highland Reserves - The Estates
- Sinclair Plan at Highland Reserves
- Adams IV H Plan at Highland Reserves - The Estates
- Jacob IV H Plan at Highland Reserves - The Estates
- Crocker III G Plan at Highland Reserves - The Estates
- Jacob IV G Plan at Highland Reserves - The Estates
- Augusta B Plan at The Greens at Legacy Townhomes
- Pinehurst II A Plan at The Greens at Legacy Townhomes
- 1112 Ellis Ct
- 1106 Ellis Ct
- 1109 Ellis Ct
- 769 Balthrop Rd
- 763 Balthrop Rd
- 1116 Ellis Ct
- 1105 Ellis Ct
- 810 Balthrop Rd
- 768 Balthrop Rd
- 1119 Ellis Ct
- 759 Balthrop Rd
- 764 Balthrop Rd
- 830 Balthrop Rd
- 762 Balthrop Rd
- 809 Balthrop Rd
- 758 Balthrop Rd
- 832 Balthrop Rd
- 755 Balthrop Rd
- 754 Balthrop Rd
- 833 Balthrop Rd