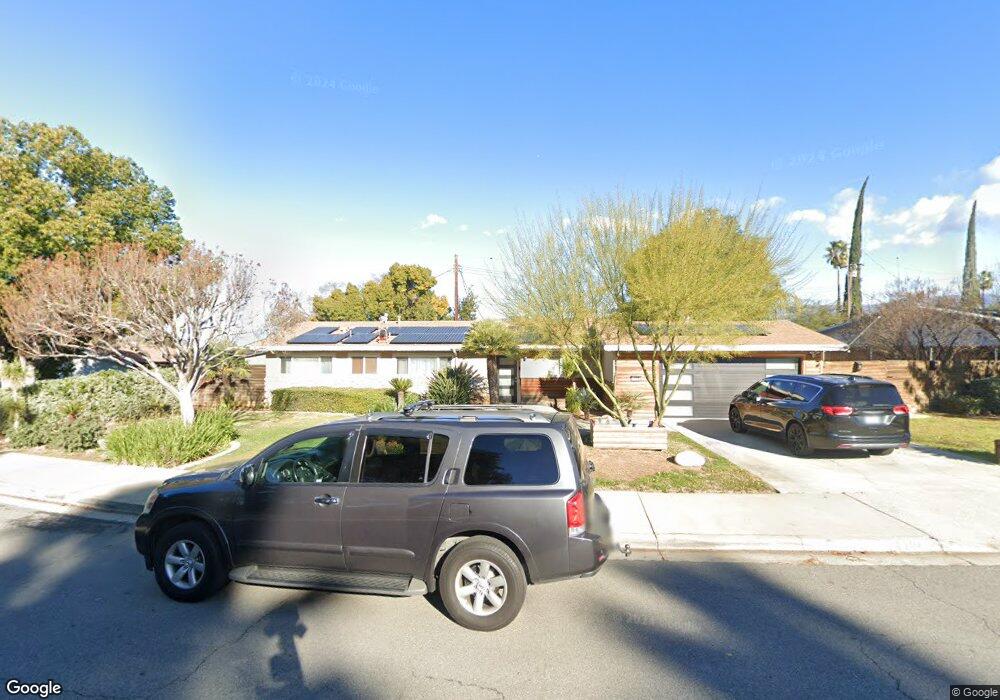
1108 Fletcher Ave Redlands, CA 92373
South Redlands NeighborhoodEstimated Value: $594,000 - $664,000
4
Beds
2
Baths
1,372
Sq Ft
$452/Sq Ft
Est. Value
About This Home
This home is located at 1108 Fletcher Ave, Redlands, CA 92373 and is currently estimated at $619,634, approximately $451 per square foot. 1108 Fletcher Ave is a home located in San Bernardino County with nearby schools including Smiley Elementary School, Cope Middle School, and Redlands Senior High School.
Ownership History
Date
Name
Owned For
Owner Type
Purchase Details
Closed on
Apr 24, 2010
Sold by
Arias Lilia
Bought by
Arias Lilia
Current Estimated Value
Home Financials for this Owner
Home Financials are based on the most recent Mortgage that was taken out on this home.
Original Mortgage
$228,190
Outstanding Balance
$152,283
Interest Rate
5.04%
Mortgage Type
New Conventional
Estimated Equity
$467,351
Purchase Details
Closed on
Jun 10, 2004
Sold by
Guevara Mario
Bought by
Arias Lilia
Home Financials for this Owner
Home Financials are based on the most recent Mortgage that was taken out on this home.
Original Mortgage
$248,000
Interest Rate
6.31%
Mortgage Type
Purchase Money Mortgage
Purchase Details
Closed on
May 27, 1999
Sold by
Braga Richard F
Bought by
Imbriani John
Home Financials for this Owner
Home Financials are based on the most recent Mortgage that was taken out on this home.
Original Mortgage
$163,903
Interest Rate
7.05%
Mortgage Type
FHA
Create a Home Valuation Report for This Property
The Home Valuation Report is an in-depth analysis detailing your home's value as well as a comparison with similar homes in the area
Home Values in the Area
Average Home Value in this Area
Purchase History
| Date | Buyer | Sale Price | Title Company |
|---|---|---|---|
| Arias Lilia | -- | None Available | |
| Arias Lilia | -- | First American | |
| Arias Lilia | $310,000 | First American | |
| Imbriani John | $165,000 | Chicago Title Co |
Source: Public Records
Mortgage History
| Date | Status | Borrower | Loan Amount |
|---|---|---|---|
| Open | Arias Lilia | $228,190 | |
| Closed | Arias Lilia | $248,000 | |
| Previous Owner | Imbriani John | $163,903 |
Source: Public Records
Tax History Compared to Growth
Tax History
| Year | Tax Paid | Tax Assessment Tax Assessment Total Assessment is a certain percentage of the fair market value that is determined by local assessors to be the total taxable value of land and additions on the property. | Land | Improvement |
|---|---|---|---|---|
| 2025 | $4,940 | $432,117 | $108,030 | $324,087 |
| 2024 | $4,940 | $423,644 | $105,912 | $317,732 |
| 2023 | $4,933 | $415,337 | $103,835 | $311,502 |
| 2022 | $4,860 | $407,193 | $101,799 | $305,394 |
| 2021 | $4,947 | $399,209 | $99,803 | $299,406 |
| 2020 | $4,872 | $395,116 | $98,780 | $296,336 |
| 2019 | $4,734 | $387,368 | $96,843 | $290,525 |
| 2018 | $4,614 | $379,772 | $94,944 | $284,828 |
| 2017 | $4,574 | $372,325 | $93,082 | $279,243 |
| 2016 | $4,521 | $365,025 | $91,257 | $273,768 |
| 2015 | $4,139 | $332,000 | $100,000 | $232,000 |
| 2014 | $4,145 | $332,000 | $100,000 | $232,000 |
Source: Public Records
Map
Nearby Homes
- 133 S San Mateo St
- 1239 Fulbright Ave
- 1110 W Cypress Ave
- 1044 W Cypress Ave
- 325 Lakeside Ave
- 1302 San Pablo Ave
- 521 Bond St
- 527 Nottingham Dr
- 162 Lakeside Ave
- 24 S Ash St
- 636 Harding Dr
- 1324 W Fern Ave
- 975 Brookside Ave
- 628 W Fern Ave
- 1417 Bella Vista Crescent
- 230 S Buena Vista St
- 622 Esther Way
- 87 Tennessee St Unit C
- 805 Nottingham Dr
- 9440 Hollie Dr
- 1104 Fletcher Ave
- 1105 Fulbright Ave
- 309 Hastings St
- 1111 Fletcher Ave
- 1107 Fletcher Ave
- 1034 Fletcher Ave
- 1103 Fletcher Ave
- 1029 Fulbright Ave
- 316 Hastings St
- 1035 Fletcher Ave
- 1106 Fulbright Ave
- 1120 W Fern Ave
- 1030 Fletcher Ave
- 1102 Fulbright Ave
- 305 Hastings St
- 312 Hastings St
- 1106 W Fern Ave
- 1110 W Fern Ave
- 1102 W Fern Ave
- 1032 Fulbright Ave