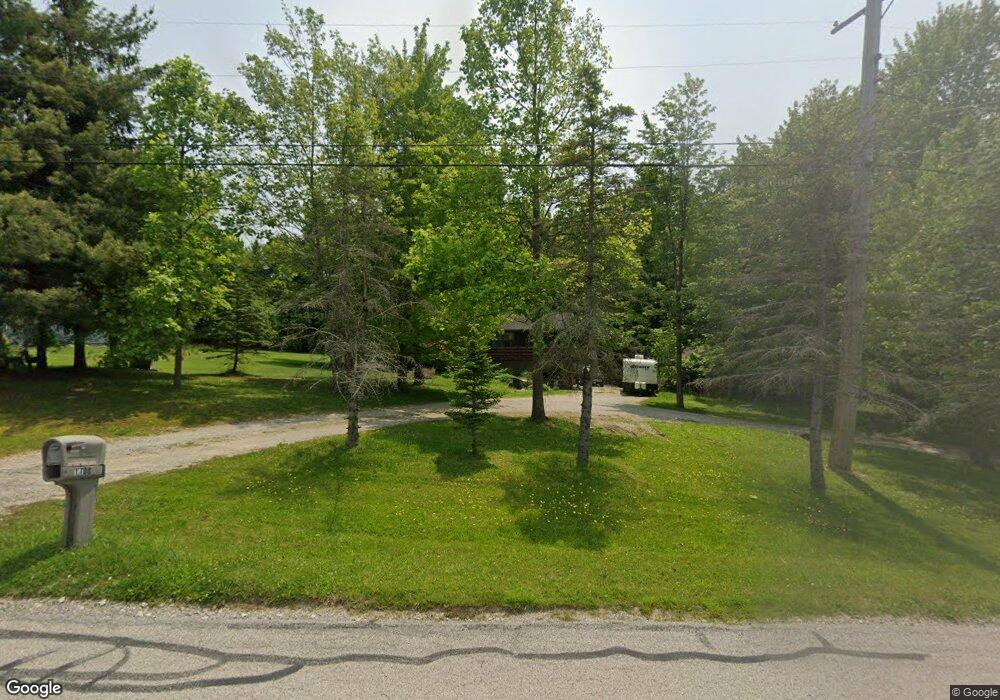
1108 Garrison Rd Ashtabula, OH 44004
Estimated Value: $201,606 - $228,000
3
Beds
2
Baths
1,120
Sq Ft
$195/Sq Ft
Est. Value
About This Home
This home is located at 1108 Garrison Rd, Ashtabula, OH 44004 and is currently estimated at $218,152, approximately $194 per square foot. 1108 Garrison Rd is a home located in Ashtabula County with nearby schools including Lakeside High School and Christian Faith Academy.
Ownership History
Date
Name
Owned For
Owner Type
Purchase Details
Closed on
Apr 12, 2019
Sold by
Hatfield John and Curtiss Kendra
Bought by
Hatfield John
Current Estimated Value
Purchase Details
Closed on
Sep 27, 2005
Sold by
Wells Fargo Bank Minnesota Na
Bought by
Hatfield John G and Hatfield Kendra J
Home Financials for this Owner
Home Financials are based on the most recent Mortgage that was taken out on this home.
Original Mortgage
$135,000
Outstanding Balance
$72,440
Interest Rate
5.8%
Mortgage Type
Fannie Mae Freddie Mac
Estimated Equity
$145,712
Purchase Details
Closed on
Jun 29, 2005
Sold by
Dort Charles Robert
Bought by
Wells Fargo Bank Minnesota Na and Home Equity Loan Asset Backed Certificat
Purchase Details
Closed on
Nov 6, 1998
Sold by
Maki Urho J
Bought by
Dort Charles R
Home Financials for this Owner
Home Financials are based on the most recent Mortgage that was taken out on this home.
Original Mortgage
$100,000
Interest Rate
6.72%
Mortgage Type
New Conventional
Create a Home Valuation Report for This Property
The Home Valuation Report is an in-depth analysis detailing your home's value as well as a comparison with similar homes in the area
Home Values in the Area
Average Home Value in this Area
Purchase History
| Date | Buyer | Sale Price | Title Company |
|---|---|---|---|
| Hatfield John | -- | None Available | |
| Hatfield John G | $135,000 | -- | |
| Wells Fargo Bank Minnesota Na | $90,000 | -- | |
| Dort Charles R | $130,000 | -- |
Source: Public Records
Mortgage History
| Date | Status | Borrower | Loan Amount |
|---|---|---|---|
| Open | Hatfield John G | $135,000 | |
| Previous Owner | Dort Charles R | $100,000 |
Source: Public Records
Tax History
| Year | Tax Paid | Tax Assessment Tax Assessment Total Assessment is a certain percentage of the fair market value that is determined by local assessors to be the total taxable value of land and additions on the property. | Land | Improvement |
|---|---|---|---|---|
| 2024 | $4,858 | $58,910 | $8,860 | $50,050 |
| 2023 | $2,777 | $58,910 | $8,860 | $50,050 |
| 2022 | $2,426 | $43,900 | $6,830 | $37,070 |
| 2021 | $2,450 | $43,900 | $6,830 | $37,070 |
| 2020 | $2,227 | $43,900 | $6,830 | $37,070 |
| 2019 | $2,365 | $44,350 | $5,250 | $39,100 |
| 2018 | $2,319 | $44,350 | $5,250 | $39,100 |
| 2017 | $2,256 | $44,350 | $5,250 | $39,100 |
| 2016 | $2,211 | $40,360 | $4,800 | $35,560 |
| 2015 | $2,209 | $40,360 | $4,800 | $35,560 |
| 2014 | $2,151 | $40,360 | $4,800 | $35,560 |
| 2013 | $2,161 | $42,500 | $6,620 | $35,880 |
Source: Public Records
Map
Nearby Homes
- 0 Usr 20 Rd Unit 5176621
- 0 S Ridge Sr 84 Rd Unit 5180557
- S Ridge Rd W Unit ASHTABULA OH
- 5923 Ogden Ave
- 507 Bunker Hill Rd
- 5860 Woodman Ave
- 923 W 58th St
- 211 W 58th St
- 5725 Main Ave
- 623 W 57th St
- 5611 Poplar Ave
- 5522 Adams Ave
- 1024 W 54th St
- 137 Grove Dr
- 5422 Madison Ave
- 5425 Adams Ave
- 6123 Lucas Ave
- 5127 Nathan Ave
- 5121 Nathan Ave
- 5308 Benefit Ave
- 1098 Garrison Rd
- 1146 Garrison Rd
- 1158 Garrison Rd
- 1115 Garrison Rd
- 1101 Garrison Rd
- 1151 Garrison Rd
- 1168 Garrison Rd
- 1078 Garrison Rd
- 1071 Garrison Rd
- 1161 Garrison Rd
- 1064 Garrison Rd
- 1178 Garrison Rd
- 1042 Garrison Rd
- 1192 Garrison Rd
- 1171 Garrison Rd
- 7645 Buttonwood Ln
- 1191 Garrison Rd
- 1026 Garrison Rd
- 7601 Buttonwood Ln
- 0 Buttonwood Ln
Your Personal Tour Guide
Ask me questions while you tour the home.