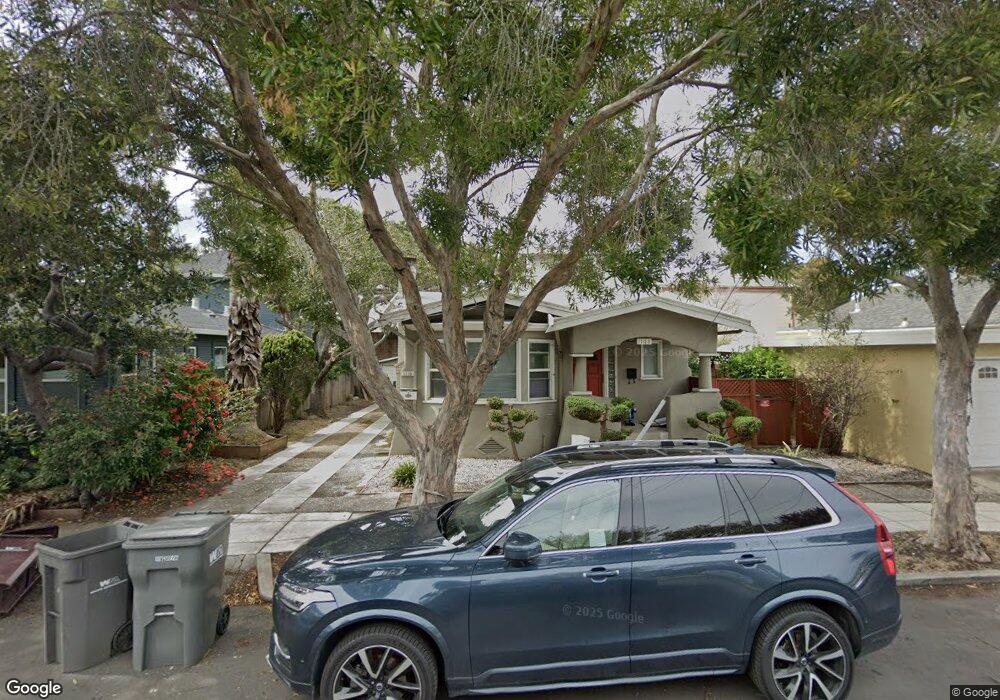
1108 Kains Ave Albany, CA 94706
Dartmouth NeighborhoodEstimated Value: $1,796,000 - $2,069,887
4
Beds
3
Baths
1,850
Sq Ft
$1,045/Sq Ft
Est. Value
About This Home
This home is located at 1108 Kains Ave, Albany, CA 94706 and is currently estimated at $1,932,944, approximately $1,044 per square foot. 1108 Kains Ave is a home located in Alameda County with nearby schools including Albany Middle School, Albany High School, and The Crowden School.
Ownership History
Date
Name
Owned For
Owner Type
Purchase Details
Closed on
May 27, 2015
Sold by
Wu Yuxin
Bought by
Wu Yuxin and Yang Xiaoyu
Current Estimated Value
Purchase Details
Closed on
May 27, 2011
Sold by
Yang Xiao Yu
Bought by
Wu Yuxin
Home Financials for this Owner
Home Financials are based on the most recent Mortgage that was taken out on this home.
Original Mortgage
$390,000
Outstanding Balance
$270,116
Interest Rate
4.73%
Mortgage Type
Commercial
Estimated Equity
$1,662,828
Purchase Details
Closed on
Sep 4, 2008
Sold by
Wong Mariam
Bought by
Zhang Yi
Home Financials for this Owner
Home Financials are based on the most recent Mortgage that was taken out on this home.
Original Mortgage
$490,000
Interest Rate
6.59%
Mortgage Type
Commercial
Purchase Details
Closed on
Sep 3, 2008
Sold by
Li Ke
Bought by
Zhang Yi
Home Financials for this Owner
Home Financials are based on the most recent Mortgage that was taken out on this home.
Original Mortgage
$490,000
Interest Rate
6.59%
Mortgage Type
Commercial
Purchase Details
Closed on
Dec 14, 2005
Sold by
Gabovich Alexander
Bought by
Wong Miriam
Home Financials for this Owner
Home Financials are based on the most recent Mortgage that was taken out on this home.
Original Mortgage
$656,000
Interest Rate
7.55%
Mortgage Type
Purchase Money Mortgage
Purchase Details
Closed on
Dec 28, 2004
Sold by
The Harbison Co
Bought by
Gabovich Alexander
Home Financials for this Owner
Home Financials are based on the most recent Mortgage that was taken out on this home.
Original Mortgage
$477,000
Interest Rate
6.75%
Mortgage Type
Commercial
Purchase Details
Closed on
Dec 21, 2004
Sold by
Gabovich Natalie
Bought by
Gabovich Alexander
Home Financials for this Owner
Home Financials are based on the most recent Mortgage that was taken out on this home.
Original Mortgage
$477,000
Interest Rate
6.75%
Mortgage Type
Commercial
Purchase Details
Closed on
Feb 20, 2004
Sold by
Harbison Michael E and Harbison Andrea D
Bought by
The Harbison Co and Ellis Properties Inc
Purchase Details
Closed on
Feb 19, 2004
Sold by
Harbison Michael E and Harbison Andrea D
Bought by
Harbison Michael E and Harbison Andrea D
Purchase Details
Closed on
Oct 14, 2003
Sold by
Smith Donna L
Bought by
Harbison Michael E and Harbison Andrea D
Purchase Details
Closed on
Aug 20, 1996
Sold by
Simmons Ruby M
Bought by
The Trust Of Ruby M Simmons
Purchase Details
Closed on
Oct 4, 1993
Sold by
Simmons Ruby M
Bought by
Simmons Ruby M
Create a Home Valuation Report for This Property
The Home Valuation Report is an in-depth analysis detailing your home's value as well as a comparison with similar homes in the area
Home Values in the Area
Average Home Value in this Area
Purchase History
| Date | Buyer | Sale Price | Title Company |
|---|---|---|---|
| Wu Yuxin | -- | None Available | |
| Wu Yuxin | -- | Orange Coast Title Company | |
| Wu Yuxin | $690,000 | Orange Coast Title Company | |
| Zhang Yi | $710,000 | First American Title Company | |
| Zhang Yi | -- | First American Title Company | |
| Wong Miriam | $820,000 | North American Title Co | |
| Gabovich Alexander | $530,000 | Chicago Title Co | |
| Gabovich Alexander | -- | Chicago Title Co | |
| The Harbison Co | -- | -- | |
| Harbison Michael E | -- | -- | |
| Harbison Michael E | $415,000 | Chicago Title Company | |
| The Trust Of Ruby M Simmons | -- | -- | |
| Simmons Ruby M | -- | -- | |
| Simmons Ruby M | -- | -- |
Source: Public Records
Mortgage History
| Date | Status | Borrower | Loan Amount |
|---|---|---|---|
| Open | Wu Yuxin | $390,000 | |
| Previous Owner | Zhang Yi | $490,000 | |
| Previous Owner | Wong Miriam | $656,000 | |
| Previous Owner | Gabovich Alexander | $477,000 |
Source: Public Records
Tax History Compared to Growth
Tax History
| Year | Tax Paid | Tax Assessment Tax Assessment Total Assessment is a certain percentage of the fair market value that is determined by local assessors to be the total taxable value of land and additions on the property. | Land | Improvement |
|---|---|---|---|---|
| 2025 | $16,822 | $876,958 | $265,187 | $618,771 |
| 2024 | $16,822 | $859,632 | $259,989 | $606,643 |
| 2023 | $16,051 | $849,644 | $254,893 | $594,751 |
| 2022 | $15,538 | $825,988 | $249,896 | $583,092 |
| 2021 | $15,307 | $809,655 | $244,996 | $571,659 |
| 2020 | $15,137 | $808,286 | $242,486 | $565,800 |
| 2019 | $14,788 | $792,444 | $237,733 | $554,711 |
| 2018 | $14,384 | $776,911 | $233,073 | $543,838 |
| 2017 | $14,020 | $761,683 | $228,505 | $533,178 |
| 2016 | $13,403 | $746,751 | $224,025 | $522,726 |
| 2015 | $12,580 | $735,540 | $220,662 | $514,878 |
| 2014 | $12,824 | $721,131 | $216,339 | $504,792 |
Source: Public Records
Map
Nearby Homes
- 1112 Kains Ave
- 1114 Dartmouth St
- 1112 Dartmouth St
- 1114 Kains Ave
- 1111 San Pablo Ave
- 1116 Kains Ave
- 1107 Kains Ave
- 1103 Kains Ave
- 1111 Kains Ave
- 1115 Dartmouth St
- 1111 Dartmouth St
- 1109 Dartmouth St
- 1089 San Pablo Ave
- 1113 Kains Ave
- 1107 Dartmouth St
- 1117 Kains Ave
- 1121 Dartmouth St
- 1070 Kains Ave
- 1123 Dartmouth St
- 1121 Kains Ave