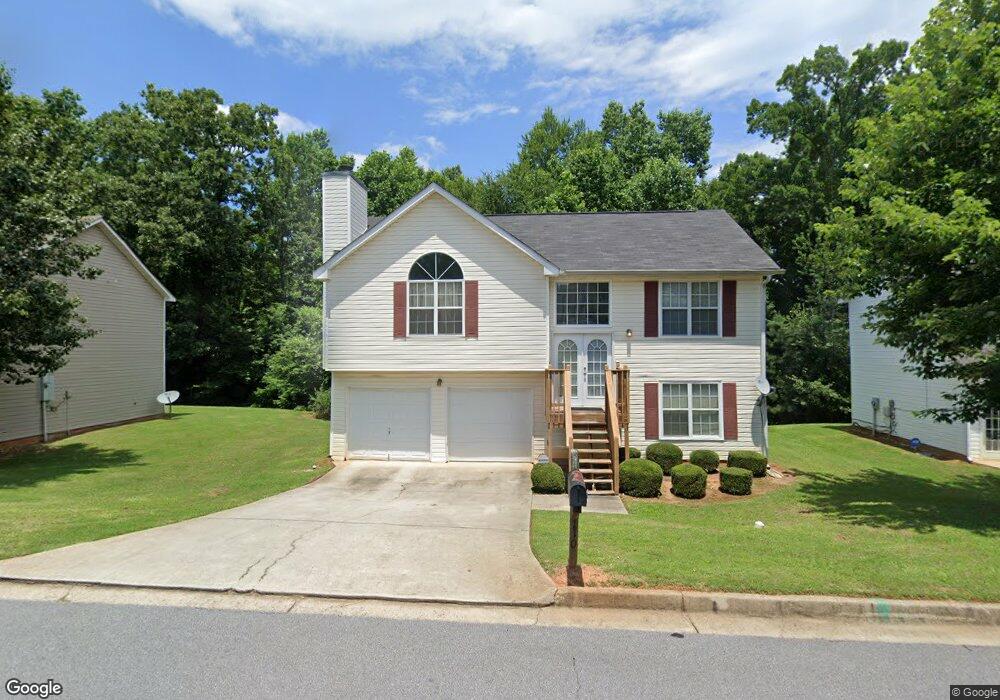
1108 Misty Meadows Ln Unit 2 Hampton, GA 30228
Estimated Value: $222,000 - $235,347
4
Beds
3
Baths
1,444
Sq Ft
$159/Sq Ft
Est. Value
About This Home
This home is located at 1108 Misty Meadows Ln Unit 2, Hampton, GA 30228 and is currently estimated at $229,087, approximately $158 per square foot. 1108 Misty Meadows Ln Unit 2 is a home located in Clayton County with nearby schools including Kemp Primary School, Kemp Elementary School, and Eddie White Academy.
Ownership History
Date
Name
Owned For
Owner Type
Purchase Details
Closed on
Aug 14, 2008
Sold by
Affordable Hsng Assistance Inc
Bought by
Battle Lashanda
Current Estimated Value
Home Financials for this Owner
Home Financials are based on the most recent Mortgage that was taken out on this home.
Original Mortgage
$79,576
Outstanding Balance
$52,286
Interest Rate
6.61%
Mortgage Type
FHA
Estimated Equity
$176,801
Purchase Details
Closed on
May 28, 2008
Sold by
Hud-Housing Of Urban Dev
Bought by
Affordable Hsng Assistance Inc
Home Financials for this Owner
Home Financials are based on the most recent Mortgage that was taken out on this home.
Original Mortgage
$64,000
Interest Rate
5.86%
Purchase Details
Closed on
Sep 4, 2007
Sold by
Washington Mutual Bank
Bought by
Hud-Housing Of Urban Dev
Purchase Details
Closed on
May 31, 2001
Sold by
Stonebridge Creek Dev Co Inc
Bought by
Holder Robert L and Holder Kimberly A
Home Financials for this Owner
Home Financials are based on the most recent Mortgage that was taken out on this home.
Original Mortgage
$109,500
Interest Rate
7.16%
Mortgage Type
FHA
Create a Home Valuation Report for This Property
The Home Valuation Report is an in-depth analysis detailing your home's value as well as a comparison with similar homes in the area
Home Values in the Area
Average Home Value in this Area
Purchase History
| Date | Buyer | Sale Price | Title Company |
|---|---|---|---|
| Battle Lashanda | $84,500 | -- | |
| Affordable Hsng Assistance Inc | -- | -- | |
| Hud-Housing Of Urban Dev | -- | -- | |
| Washington Mutual Bank | $151,198 | -- | |
| Holder Robert L | $111,300 | -- |
Source: Public Records
Mortgage History
| Date | Status | Borrower | Loan Amount |
|---|---|---|---|
| Open | Battle Lashanda | $79,576 | |
| Previous Owner | Affordable Hsng Assistance Inc | $64,000 | |
| Previous Owner | Holder Robert L | $109,500 |
Source: Public Records
Tax History
| Year | Tax Paid | Tax Assessment Tax Assessment Total Assessment is a certain percentage of the fair market value that is determined by local assessors to be the total taxable value of land and additions on the property. | Land | Improvement |
|---|---|---|---|---|
| 2025 | $3,319 | $95,680 | $8,800 | $86,880 |
| 2024 | $3,253 | $92,400 | $8,800 | $83,600 |
| 2023 | $3,182 | $88,120 | $8,800 | $79,320 |
| 2022 | $2,970 | $84,720 | $8,800 | $75,920 |
| 2021 | $2,046 | $60,840 | $8,800 | $52,040 |
| 2020 | $1,522 | $47,094 | $8,800 | $38,294 |
| 2019 | $1,534 | $46,854 | $7,200 | $39,654 |
| 2018 | $1,343 | $42,145 | $7,200 | $34,945 |
| 2017 | $1,112 | $36,405 | $7,200 | $29,205 |
| 2016 | $925 | $31,797 | $7,200 | $24,597 |
| 2015 | $910 | $0 | $0 | $0 |
| 2014 | $772 | $28,432 | $7,200 | $21,232 |
Source: Public Records
Map
Nearby Homes
- 1067 Misty Meadows Point Unit 2
- 1098 Village Creek
- 10600 Pine Forest Ln
- 10454 Iron Gate Ln
- 1141 Sunday Ln
- 10617 Barberry Dr
- 10990 Clearwater Dr
- 10410 Iron Gate Ln
- 1067 Brookview Ln
- 10571 Starling Trail Unit II
- 10897 Paladin Dr
- 10725 Barberry Dr Unit 5
- 1362 Tara Rd
- 1278 Lynx Ct
- 10338 Canyon Trail
- 1342 Winslow Dr
- 1329 Birdsong Ln
- 10312 Canyon Trail
- 1241 Larkwood Dr
- 1350 Birdsong Ln
- 1108 Misty Meadows Ln
- 1102 Misty Meadows Ln
- 1116 Misty Meadows Ln
- 10641 Tara Village Way
- 1094 Misty Meadows Ln Unit 84
- 1094 Misty Meadows Ln
- 1124 Misty Meadows Ln Unit 88
- 1124 Misty Meadows Ln Unit 1124
- 1124 Misty Meadows Ln
- 10633 Tara Village Way
- 1109 Misty Meadows Ln
- 1099 Misty Meadows Ln
- 1117 Misty Meadows Ln Unit 2
- 1132 Misty Meadows Ln Unit 89
- 1132 Misty Meadows Ln
- 10625 Tara Village Way
- 1084 Misty Meadows Ln Unit 2
- 1071 Misty Meadows Ln Unit 2
- 10617 Tara Village Way
- 10650 Tara Village Way Unit 166
Your Personal Tour Guide
Ask me questions while you tour the home.