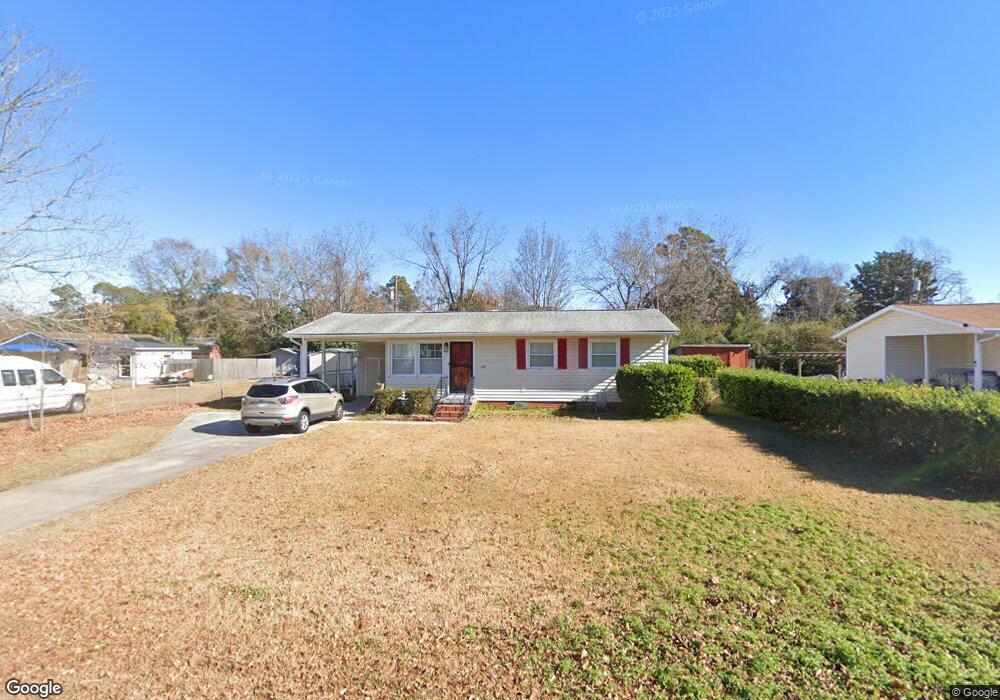
1108 Oak Dr Myrtle Beach, SC 29577
Downtown Myrtle Beach NeighborhoodEstimated Value: $199,000 - $243,000
3
Beds
1
Bath
925
Sq Ft
$241/Sq Ft
Est. Value
About This Home
This home is located at 1108 Oak Dr, Myrtle Beach, SC 29577 and is currently estimated at $223,017, approximately $241 per square foot. 1108 Oak Dr is a home located in Horry County with nearby schools including Myrtle Beach Child Development Center, Myrtle Beach Primary School, and Myrtle Beach Middle School.
Ownership History
Date
Name
Owned For
Owner Type
Purchase Details
Closed on
Dec 2, 2022
Sold by
Arevalo Edward E
Bought by
Graves Dakota and Graves Allison
Current Estimated Value
Home Financials for this Owner
Home Financials are based on the most recent Mortgage that was taken out on this home.
Original Mortgage
$204,250
Outstanding Balance
$197,086
Interest Rate
6.95%
Mortgage Type
New Conventional
Estimated Equity
$25,931
Purchase Details
Closed on
May 21, 2021
Sold by
Smith Cathiline W
Bought by
Arevalo Jocelyn Dagdag and Arevalo Edward E
Home Financials for this Owner
Home Financials are based on the most recent Mortgage that was taken out on this home.
Original Mortgage
$123,920
Interest Rate
2.9%
Mortgage Type
New Conventional
Purchase Details
Closed on
Sep 4, 2002
Sold by
Stubbs Robert C and Stubbs Marie S
Bought by
Smith William K and Smith Cathiline W
Home Financials for this Owner
Home Financials are based on the most recent Mortgage that was taken out on this home.
Original Mortgage
$69,350
Interest Rate
6.3%
Mortgage Type
Purchase Money Mortgage
Create a Home Valuation Report for This Property
The Home Valuation Report is an in-depth analysis detailing your home's value as well as a comparison with similar homes in the area
Home Values in the Area
Average Home Value in this Area
Purchase History
| Date | Buyer | Sale Price | Title Company |
|---|---|---|---|
| Graves Dakota | $215,000 | -- | |
| Arevalo Jocelyn Dagdag | $154,900 | -- | |
| Smith William K | $73,000 | -- |
Source: Public Records
Mortgage History
| Date | Status | Borrower | Loan Amount |
|---|---|---|---|
| Open | Graves Dakota | $204,250 | |
| Closed | Graves Dakota | $204,250 | |
| Previous Owner | Arevalo Jocelyn Dagdag | $123,920 | |
| Previous Owner | Smith William K | $69,350 |
Source: Public Records
Tax History
| Year | Tax Paid | Tax Assessment Tax Assessment Total Assessment is a certain percentage of the fair market value that is determined by local assessors to be the total taxable value of land and additions on the property. | Land | Improvement |
|---|---|---|---|---|
| 2025 | $783 | $0 | $0 | $0 |
| 2024 | $783 | $8,779 | $3,000 | $5,779 |
| 2023 | $783 | $3,135 | $1,010 | $2,125 |
| 2021 | $655 | $3,601 | $1,017 | $2,584 |
| 2020 | $0 | $3,601 | $1,017 | $2,584 |
| 2019 | $56 | $3,601 | $1,017 | $2,584 |
| 2018 | $0 | $2,726 | $878 | $1,848 |
| 2017 | -- | $2,726 | $878 | $1,848 |
| 2016 | -- | $2,726 | $878 | $1,848 |
| 2015 | $56 | $2,726 | $878 | $1,848 |
| 2014 | $50 | $2,726 | $878 | $1,848 |
Source: Public Records
Map
Nearby Homes
- 128 Hoffman Park Dr
- 128 Hoffman Park Dr Unit 3
- 1105 Highway 15
- 1636 Stuart Square Cir
- 978 Periwinkle Place
- 935 Southpark Dr
- TBD Highway 15
- 1129 9th Ave S
- 944 Pine Thicket St
- 914 5th Ave S
- 850 Maxine Ct Unit 5B
- 1047 Pinwheel Loop Unit Parkview, 1047 Pinwh
- 1719 Low Country Place Unit B
- 904 Southpark Dr
- 1115 Scott Dr
- 1065 Pinwheel Loop
- 830 Whispering Tide Ct Unit F
- 830 Whispering Tide Ct Unit E
- 830 Whispering Tide Ct Unit A
- 830 Whispering Tide Ct Unit D
Your Personal Tour Guide
Ask me questions while you tour the home.