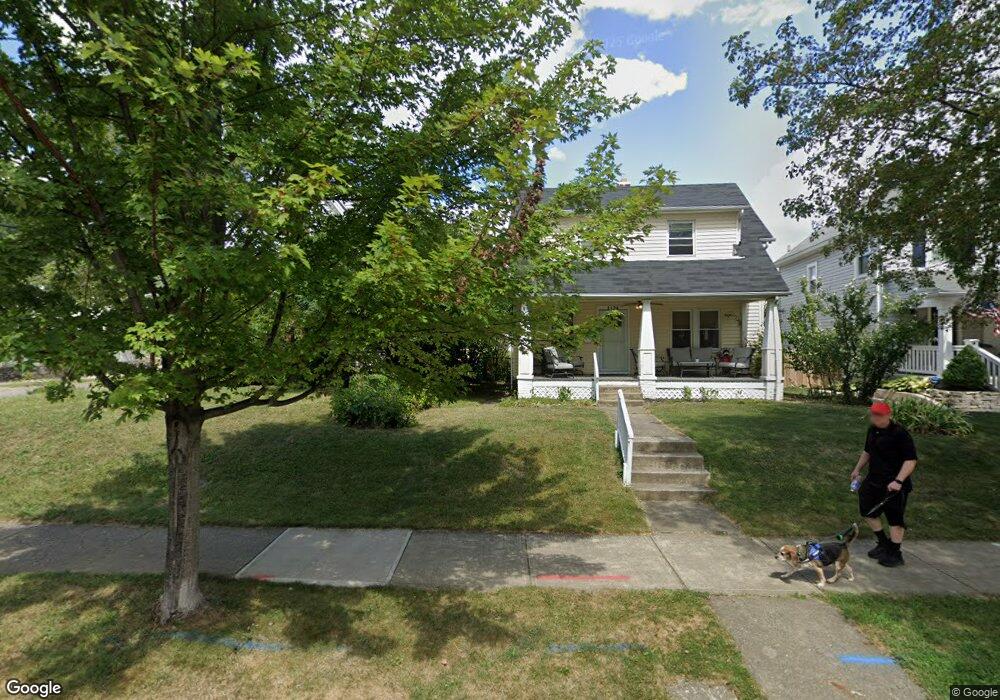
1108 W 2nd Ave Unit 110 Columbus, OH 43212
Estimated Value: $278,000 - $365,572
6
Beds
2
Baths
2,352
Sq Ft
$143/Sq Ft
Est. Value
About This Home
This home is located at 1108 W 2nd Ave Unit 110, Columbus, OH 43212 and is currently estimated at $337,393, approximately $143 per square foot. 1108 W 2nd Ave Unit 110 is a home located in Franklin County with nearby schools including Robert Louis Stevenson Elementary School, Larson Middle School, and Grandview Heights High School.
Ownership History
Date
Name
Owned For
Owner Type
Purchase Details
Closed on
May 13, 2020
Sold by
Henderson Thomas T and Henderson Leanna K
Bought by
Henderson Holdings Llc
Current Estimated Value
Purchase Details
Closed on
Dec 24, 2015
Sold by
Deutsche Bank Trust Company
Bought by
Henderson Leanna and Henderson Thomas
Purchase Details
Closed on
Jul 23, 2015
Sold by
Talmon Joseph A
Bought by
Deutsch Bank Trsut Co Amaerica and Residential Accredit Loans Inc
Purchase Details
Closed on
Sep 3, 1999
Sold by
Edmond Turner
Bought by
Talmon Joseph A
Home Financials for this Owner
Home Financials are based on the most recent Mortgage that was taken out on this home.
Original Mortgage
$41,520
Interest Rate
7.25%
Purchase Details
Closed on
Dec 10, 1992
Bought by
Edmond Turner
Purchase Details
Closed on
Jun 1, 1979
Create a Home Valuation Report for This Property
The Home Valuation Report is an in-depth analysis detailing your home's value as well as a comparison with similar homes in the area
Home Values in the Area
Average Home Value in this Area
Purchase History
| Date | Buyer | Sale Price | Title Company |
|---|---|---|---|
| Henderson Holdings Llc | -- | None Available | |
| Henderson Leanna | $27,469 | Attorney | |
| Deutsch Bank Trsut Co Amaerica | $28,000 | Attorney | |
| Talmon Joseph A | $51,900 | -- | |
| Edmond Turner | $41,000 | -- | |
| -- | $27,500 | -- |
Source: Public Records
Mortgage History
| Date | Status | Borrower | Loan Amount |
|---|---|---|---|
| Previous Owner | Talmon Joseph A | $41,520 |
Source: Public Records
Tax History Compared to Growth
Tax History
| Year | Tax Paid | Tax Assessment Tax Assessment Total Assessment is a certain percentage of the fair market value that is determined by local assessors to be the total taxable value of land and additions on the property. | Land | Improvement |
|---|---|---|---|---|
| 2024 | $4,034 | $88,030 | $23,450 | $64,580 |
| 2023 | $3,984 | $88,025 | $23,450 | $64,575 |
| 2022 | $1,724 | $32,450 | $5,670 | $26,780 |
| 2021 | $1,728 | $32,450 | $5,670 | $26,780 |
| 2020 | $1,730 | $32,450 | $5,670 | $26,780 |
| 2019 | $1,700 | $24,920 | $4,340 | $20,580 |
| 2018 | $1,341 | $24,920 | $4,340 | $20,580 |
| 2017 | $1,460 | $24,920 | $4,340 | $20,580 |
| 2016 | $1,321 | $17,780 | $3,570 | $14,210 |
| 2015 | $493 | $17,780 | $3,570 | $14,210 |
| 2014 | $1,102 | $17,780 | $3,570 | $14,210 |
| 2013 | $572 | $18,690 | $3,745 | $14,945 |
Source: Public Records
Map
Nearby Homes
- 1240 Oxley Rd
- 1083 W 3rd Ave
- 1242 Oxley Rd
- 1093 W 3rd Ave
- 1225 Eastview Ave
- 1095 W 3rd Ave
- 1111 Northwest Blvd Unit 113
- 1081 W 3rd Ave
- 1081 Northwest Blvd Unit 2
- 1297 Doten Ave
- 1129 Mulford Rd
- 932 Mcclain Rd
- 922 Northwest Blvd
- 910-912 Northwest Blvd
- 860 Palmer Rd
- 1475 W 3rd Ave Unit 204
- 1126 King Ave Unit 128
- 00 W 7th Ave
- 1364 W 7th Ave
- 0 Bradley St
- 1108 W 2nd Ave Unit 110
- 1106 2nd St
- 1106 W 2nd Ave
- 1114 W 2nd Ave Unit 116
- 1102 W 2nd Ave
- 1102 W 2nd Ave Unit 104
- 1116 W 2nd Ave
- 1096 W 2nd Ave
- 1096 W 2nd Ave Unit 98
- 1107 W 2nd Ave Unit 109
- 1097 W 2nd Ave Unit TWENTY
- 1092 W 2nd Ave
- 1091 W 2nd Ave Unit TWENTY
- 1126 W 2nd Ave
- 1086 W 2nd Ave
- 1101 W 2nd Ave
- 1101 W 2nd Ave Unit 103
- 1224 Oxley Rd
- 1215 Holly Ave
- 1130 W 2nd Ave