NOT LISTED FOR SALE

Estimated Value: $184,000 - $224,511

3 Beds
1 Bath
1,072 Sq Ft
$196/Sq Ft Est. Value

Last Sold August 23, 2013

Last sale price $93,500 $87 Per Sq Ft

Est. 124% increase in value since last sale

Current estimated payment $1,253/month

About This Home

As of August 2013

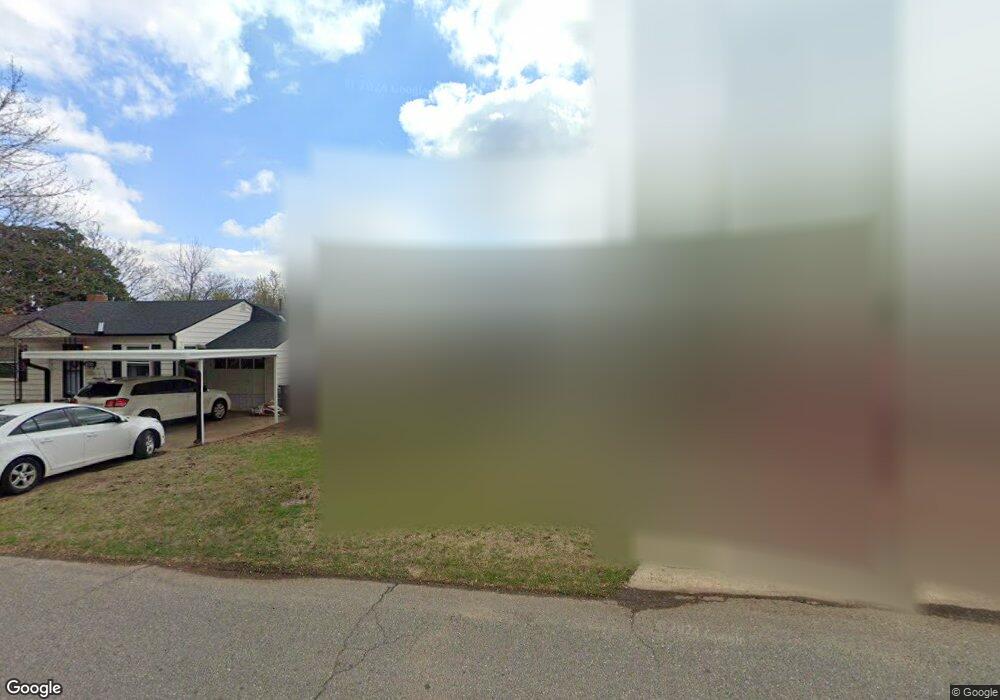
Well maintained/ Great potential! Good location near central Norman and close proximity to O.U. Spacious Living and Dining. Washer/Dryer Hookups inside. Newer Roof and H/A; Updated Light Fixtures; Large Backyard. Vinyl Siding w/ Attached Carport.

Ownership History

Date Name Owned For Owner Type

Purchase Details

Closed on
Jun 27, 2024
Sold by
Gray Curtis Lee and Gray Danielle
Bought by
Gray Trust and Gray
Current Estimated Value
$209,878

Purchase Details

Listed on
Jul 15, 2013
Closed on
Aug 23, 2013
Sold by
Smith Lee Fay and Cleveland Anetta Mae
Bought by
Gray Curtis L and Gray Danielle
Seller's Agent
Marsha Buckley
Metro Brokers of OK Southwest
Buyer's Agent
Marsha Buckley
Metro Brokers of OK Southwest
List Price
$99,950
Sold Price
$93,500
Premium/Discount to List
-$6,450
-6.45%

Home Financials for this Owner

Home Financials are based on the most recent Mortgage that was taken out on this home.
Avg. Annual Appreciation
6.88%
Original Mortgage
$70,125
Interest Rate
4.53%
Mortgage Type
New Conventional
Source: Public Records

Range of Values:

Collateral Analytics

Collateral Analytics Collateral Analytics AVMs (Automated Valuation Model) employ a number of statistical approaches combined with neighborhood-specific comparable selection guarantees the most up-to-date and precise valuations.

Not Available

Collateral Analytics does not have data for the current month. Please view the chart for historical values.

ICE

ICE Mortgage Technology ICE Mortgage Technology’s AVM (Automated Valuation Model) is a state-of-the-art online residential property valuation tool that provides a quick and accurate estimate of the value of almost any home in the U.S.

Not Available

ICE Mortgage Technology does not have data for the current month. Please view the chart for historical values.

First American

First American First American Data & Analytics’ next-generation AVM combines unrivaled data assets with a blended ensemble of valuation models to produce highly accurate, reliable valuations you can trust.

Not Available

First American does not have data for the current month. Please view the chart for historical values.

Quantarium

Quantarium Quantarium’s valuation service, repeatedly proven the industry’s most accurate and comprehensive, is supercharged with a self-learning and auto-tuning AI engine that continually becomes smarter and more accurate as it processes daily inputs from the industry’s leading RE data lake.

Not Available

Quantarium does not have data for the current month. Please view the chart for historical values.

Average Value
Not Available
List Price
Sold Price
Create a Home Valuation Report for This Property
The Home Valuation Report is an in-depth analysis detailing your home's value as well as a comparison with similar homes in the area

Home Values in the Area

Source: Public Records

Average Home Value in this Area


Source: Public Records

Purchase History

Date Buyer Sale Price Title Company
Gray Trust -- None Listed On Document
Gray Curtis L $93,500 None Available
Source: Public Records

Mortgage History

Date Status Borrower Loan Amount
Previous Owner Gray Curtis L $70,125
Source: Public Records

Property History

Date Event Price List to Sale Price per Sq Ft Prior Sale
08/23/2013 08/23/13 Sold $93,500 -6.5% $87 / Sq Ft View Prior Sale
07/26/2013 07/26/13 Pending -- -- --
07/15/2013 07/15/13 For Sale $99,950 -- $93 / Sq Ft

Tax History Compared to Growth

Source: Public Records

Tax History

Year Tax Paid Tax Assessment Tax Assessment Total Assessment is a certain percentage of the fair market value that is determined by local assessors to be the total taxable value of land and additions on the property. Land Improvement
2024 $1,696 $14,159 $3,775 $10,384
2023 $1,619 $13,484 $3,642 $9,842
2022 $1,478 $12,842 $3,446 $9,396
2021 $1,484 $12,231 $3,329 $8,902
2020 $1,385 $11,648 $3,204 $8,444
2019 $1,340 $11,094 $3,126 $7,968
2018 $1,238 $10,566 $2,400 $8,166
2017 $1,253 $10,566 $0 $0
2016 $1,273 $10,566 $2,400 $8,166
2015 $1,185 $10,146 $1,980 $8,166
2014 $1,195 $10,133 $847 $9,286
Source: Public Records

Agents Affiliated with this Home

  • Section Image
See All Agents

Map