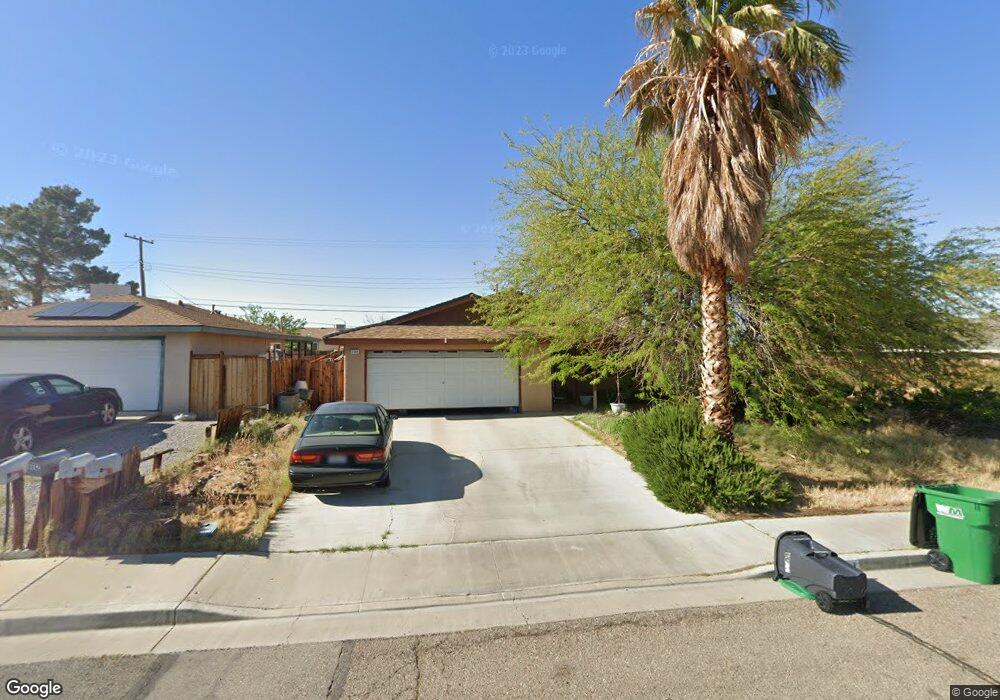
1108 W Iowa Ave Ridgecrest, CA 93555
Estimated Value: $230,000 - $259,676
3
Beds
2
Baths
1,365
Sq Ft
$184/Sq Ft
Est. Value
About This Home
This home is located at 1108 W Iowa Ave, Ridgecrest, CA 93555 and is currently estimated at $250,669, approximately $183 per square foot. 1108 W Iowa Ave is a home located in Kern County with nearby schools including Faller Elementary School, James Monroe Middle School, and Burroughs High School.
Ownership History
Date
Name
Owned For
Owner Type
Purchase Details
Closed on
Jul 24, 2002
Sold by
Miller Paul E and Miller Christy R
Bought by
Stephenson William A and Stephenson Kathleen M
Current Estimated Value
Home Financials for this Owner
Home Financials are based on the most recent Mortgage that was taken out on this home.
Original Mortgage
$71,900
Outstanding Balance
$29,874
Interest Rate
6.43%
Estimated Equity
$220,795
Purchase Details
Closed on
Nov 19, 1998
Sold by
Miller Melanie F
Bought by
Miller Paul E
Home Financials for this Owner
Home Financials are based on the most recent Mortgage that was taken out on this home.
Original Mortgage
$65,027
Interest Rate
6.73%
Mortgage Type
VA
Purchase Details
Closed on
Dec 23, 1994
Sold by
Watkins Linda
Bought by
Miller Paul E and Miller Melanie F
Home Financials for this Owner
Home Financials are based on the most recent Mortgage that was taken out on this home.
Original Mortgage
$65,790
Interest Rate
8.47%
Mortgage Type
Assumption
Create a Home Valuation Report for This Property
The Home Valuation Report is an in-depth analysis detailing your home's value as well as a comparison with similar homes in the area
Home Values in the Area
Average Home Value in this Area
Purchase History
| Date | Buyer | Sale Price | Title Company |
|---|---|---|---|
| Stephenson William A | $90,000 | First American Title Co | |
| Miller Paul E | -- | Commonwealth Land Title Co | |
| Miller Paul E | $64,500 | Chicago Title Insurance |
Source: Public Records
Mortgage History
| Date | Status | Borrower | Loan Amount |
|---|---|---|---|
| Open | Stephenson William A | $71,900 | |
| Previous Owner | Miller Paul E | $65,027 | |
| Previous Owner | Miller Paul E | $65,790 | |
| Closed | Stephenson William A | $13,450 |
Source: Public Records
Tax History Compared to Growth
Tax History
| Year | Tax Paid | Tax Assessment Tax Assessment Total Assessment is a certain percentage of the fair market value that is determined by local assessors to be the total taxable value of land and additions on the property. | Land | Improvement |
|---|---|---|---|---|
| 2025 | $1,886 | $130,179 | $21,712 | $108,467 |
| 2024 | $1,886 | $127,628 | $21,287 | $106,341 |
| 2023 | $1,832 | $125,126 | $20,870 | $104,256 |
| 2022 | $1,794 | $122,673 | $20,461 | $102,212 |
| 2021 | $1,725 | $120,268 | $20,060 | $100,208 |
| 2020 | $1,681 | $119,036 | $19,855 | $99,181 |
| 2019 | $1,655 | $119,036 | $19,855 | $99,181 |
| 2018 | $1,735 | $114,416 | $19,085 | $95,331 |
| 2017 | $1,729 | $112,173 | $18,711 | $93,462 |
| 2016 | $1,669 | $109,975 | $18,345 | $91,630 |
| 2015 | $1,643 | $108,324 | $18,070 | $90,254 |
| 2014 | $1,509 | $106,204 | $17,717 | $88,487 |
Source: Public Records
Map
Nearby Homes
- 432 Vista St
- 1012 W Langley Ave
- 400 Vista St
- 1236 W Langley Ave
- 400 Acacia St
- 1132 Briarwood Ave
- 1320 W Saint George Ave
- 0 W Saint George Ave
- 0 W Boston Ave
- 1409 W Upjohn Ave
- 1316 W Mariposa Ave
- 1213 W Willow Ave
- 0 St George Unit 2607540
- 349 S Margalo St
- 111 S Mahan St
- 1233 W Langley Ave
- 0 S Yorktown St
- 0 W Coronado Ave Unit SR25097540
- 0 W Coronado Ave Unit 25003301
- 0 W Coronado Ave Unit 2606380
- 1112 W Iowa Ave
- 1116 W Iowa Ave
- 1100 W Iowa Ave
- 1113 W Upjohn Ave
- 1109 W Upjohn Ave
- 1105 W Upjohn Ave
- 1109 W Iowa Ave
- 1113 W Iowa Ave
- 1105 W Iowa Ave
- 1117 W Iowa Ave
- 1101 W Iowa Ave
- 1040 W Iowa Ave
- 1108 W Langley Ave
- 1129 W Iowa Ave
- 1114 W Langley Ave
- 1041 W Iowa Ave
- 1129 W Upjohn Ave
- 1036 W Iowa Ave
- 1120 W Langley Ave
- 1132 W Iowa Ave