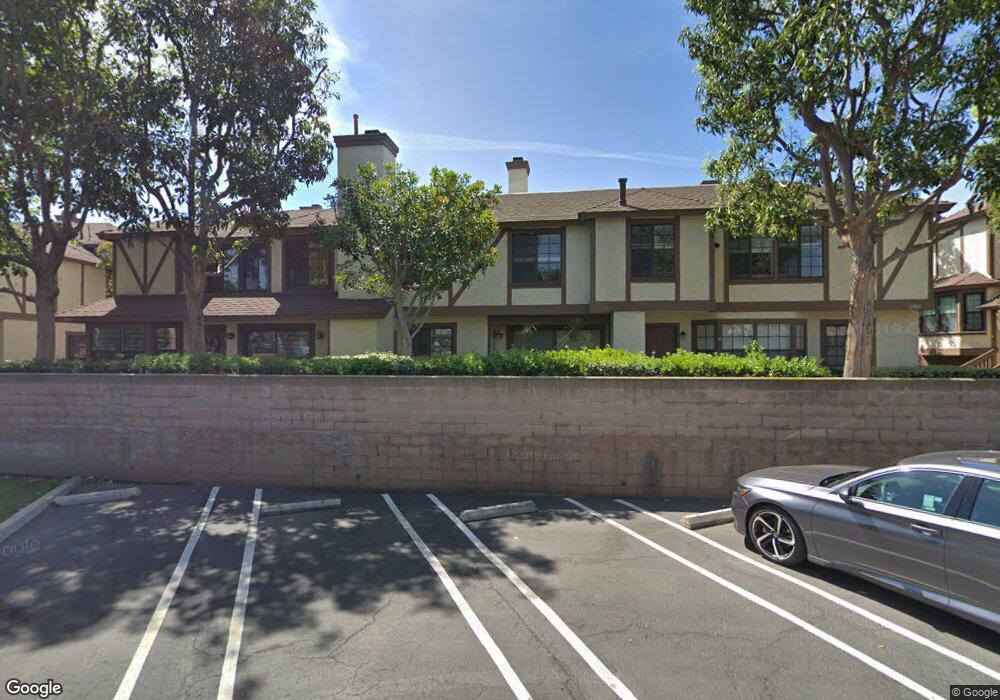
11089 Linda Ln Unit C Garden Grove, CA 92840
Estimated Value: $668,000 - $811,000
3
Beds
2
Baths
1,598
Sq Ft
$477/Sq Ft
Est. Value
About This Home
This home is located at 11089 Linda Ln Unit C, Garden Grove, CA 92840 and is currently estimated at $761,477, approximately $476 per square foot. 11089 Linda Ln Unit C is a home located in Orange County with nearby schools including Stanley Elementary School, Garden Grove High School, and St. Columban School.
Ownership History
Date
Name
Owned For
Owner Type
Purchase Details
Closed on
Mar 15, 2001
Sold by
Kim Ji Hun
Bought by
Kim Hyang Sook
Current Estimated Value
Purchase Details
Closed on
Mar 14, 2001
Sold by
Kim Hyang Sook
Bought by
Kim Hyang Sook
Purchase Details
Closed on
May 2, 2000
Sold by
Jeong Su Hyeon
Bought by
Kim Hyang Sook
Home Financials for this Owner
Home Financials are based on the most recent Mortgage that was taken out on this home.
Original Mortgage
$145,000
Interest Rate
8.53%
Purchase Details
Closed on
Jul 19, 1999
Sold by
Flaro Elizabeth M
Bought by
Jeong Su Hyeon
Home Financials for this Owner
Home Financials are based on the most recent Mortgage that was taken out on this home.
Original Mortgage
$129,500
Interest Rate
7.56%
Purchase Details
Closed on
Feb 4, 1998
Sold by
Flaro Eugene J
Bought by
Flaro Elizabeth M
Create a Home Valuation Report for This Property
The Home Valuation Report is an in-depth analysis detailing your home's value as well as a comparison with similar homes in the area
Home Values in the Area
Average Home Value in this Area
Purchase History
| Date | Buyer | Sale Price | Title Company |
|---|---|---|---|
| Kim Hyang Sook | -- | United Title Company | |
| Kim Hyang Sook | -- | United Title | |
| Kim Hyang Sook | $200,000 | United Title | |
| Jeong Su Hyeon | $185,000 | South Coast Title | |
| Flaro Elizabeth M | -- | -- |
Source: Public Records
Mortgage History
| Date | Status | Borrower | Loan Amount |
|---|---|---|---|
| Previous Owner | Kim Hyang Sook | $145,000 | |
| Previous Owner | Jeong Su Hyeon | $129,500 |
Source: Public Records
Tax History Compared to Growth
Tax History
| Year | Tax Paid | Tax Assessment Tax Assessment Total Assessment is a certain percentage of the fair market value that is determined by local assessors to be the total taxable value of land and additions on the property. | Land | Improvement |
|---|---|---|---|---|
| 2025 | $3,884 | $300,467 | $90,547 | $209,920 |
| 2024 | $3,884 | $294,576 | $88,772 | $205,804 |
| 2023 | $3,811 | $288,800 | $87,031 | $201,769 |
| 2022 | $3,729 | $283,138 | $85,325 | $197,813 |
| 2021 | $3,690 | $277,587 | $83,652 | $193,935 |
| 2020 | $3,641 | $274,741 | $82,794 | $191,947 |
| 2019 | $3,574 | $269,354 | $81,170 | $188,184 |
| 2018 | $3,504 | $264,073 | $79,578 | $184,495 |
| 2017 | $3,457 | $258,896 | $78,018 | $180,878 |
| 2016 | $3,291 | $253,820 | $76,488 | $177,332 |
| 2015 | $3,245 | $250,008 | $75,339 | $174,669 |
| 2014 | $3,168 | $245,111 | $73,863 | $171,248 |
Source: Public Records
Map
Nearby Homes
- 12600 Euclid St Unit 4
- 12600 Euclid St Unit 19
- 11052 Peppertree Ln
- 12555 Euclid St Unit 2
- 12555 Euclid St Unit 79
- 12555 Euclid St Unit 61
- 12555 S Euclid St Unit 32
- 12555 S Euclid St Unit 2
- 10836 Sonoma Ln
- 12677 8th St
- 11081 Iris Dr
- 12501 Dessa Dr
- 12332 Euclid St
- 13312 Michael Rainford Cir
- 10521 Lakeside Dr S Unit I
- 10580 Lakeside Dr N Unit E
- 10560 Lakeside Dr N Unit B
- 10541 Lakeside Dr S Unit P
- 12851 Newhope St
- 12256 Lesley St
- 11089 Linda Ln Unit D
- 11089 Linda Ln Unit A
- 11089 Linda Ln Unit B
- 11081 Linda Ln Unit C
- 11081 Linda Ln Unit D
- 11081 Linda Ln Unit A
- 11081 Linda Ln Unit B
- 11086 Linda Ln Unit A
- 11086 Linda Ln Unit C
- 11086 Linda Ln
- 11086 Linda Ln Unit D
- 11076 Linda Ln Unit A
- 11076 Linda Ln Unit C
- 11076 Linda Ln Unit B
- 11097 Linda Ln Unit A
- 11097 Linda Ln
- 11097 Linda Ln Unit 23A
- 11097 Linda Ln Unit C
- 11097 Linda Ln Unit D
- 11097 Linda Ln Unit B