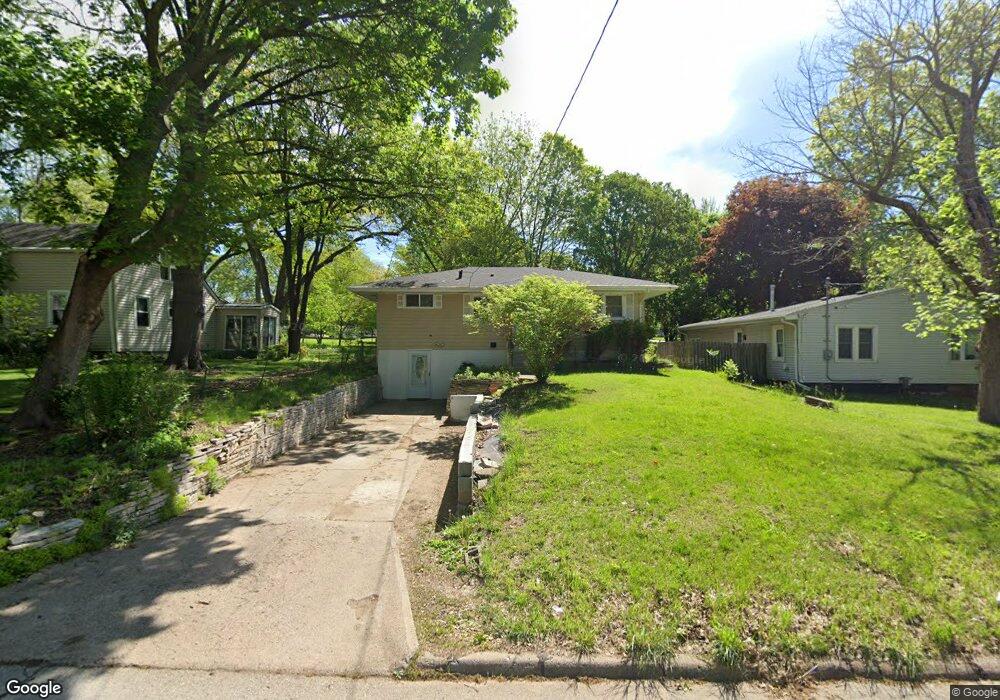
1109 65th St Windsor Heights, IA 50324
Estimated Value: $188,000 - $220,000
3
Beds
1
Bath
922
Sq Ft
$222/Sq Ft
Est. Value
About This Home
This home is located at 1109 65th St, Windsor Heights, IA 50324 and is currently estimated at $204,912, approximately $222 per square foot. 1109 65th St is a home located in Polk County with nearby schools including Windsor Elementary School, Merrill Middle School, and Roosevelt High School.
Ownership History
Date
Name
Owned For
Owner Type
Purchase Details
Closed on
Feb 22, 2006
Sold by
Sotamba Edwin and Siguencia Edison
Bought by
Pinos Carlos R and Pinos Estela A
Current Estimated Value
Home Financials for this Owner
Home Financials are based on the most recent Mortgage that was taken out on this home.
Original Mortgage
$110,580
Outstanding Balance
$62,731
Interest Rate
6.33%
Mortgage Type
FHA
Estimated Equity
$142,181
Purchase Details
Closed on
Jan 26, 2004
Sold by
Sotamba Edwin
Bought by
Sotamba Edwin and Siguencia Edison
Purchase Details
Closed on
Feb 6, 2003
Sold by
Garagnani Alison Marie and Garagnani Steven P
Bought by
Sotamba Edwin
Home Financials for this Owner
Home Financials are based on the most recent Mortgage that was taken out on this home.
Original Mortgage
$110,675
Interest Rate
5.87%
Purchase Details
Closed on
Feb 9, 2002
Sold by
Burns Margarita Grace
Bought by
Burns Margarita Grace and Garagnani Alison Marie
Create a Home Valuation Report for This Property
The Home Valuation Report is an in-depth analysis detailing your home's value as well as a comparison with similar homes in the area
Home Values in the Area
Average Home Value in this Area
Purchase History
| Date | Buyer | Sale Price | Title Company |
|---|---|---|---|
| Pinos Carlos R | $113,500 | None Available | |
| Sotamba Edwin | -- | -- | |
| Sotamba Edwin | $116,000 | -- | |
| Burns Margarita Grace | -- | -- |
Source: Public Records
Mortgage History
| Date | Status | Borrower | Loan Amount |
|---|---|---|---|
| Open | Pinos Carlos R | $110,580 | |
| Previous Owner | Sotamba Edwin | $110,675 |
Source: Public Records
Tax History Compared to Growth
Tax History
| Year | Tax Paid | Tax Assessment Tax Assessment Total Assessment is a certain percentage of the fair market value that is determined by local assessors to be the total taxable value of land and additions on the property. | Land | Improvement |
|---|---|---|---|---|
| 2025 | $2,996 | $178,200 | $31,700 | $146,500 |
| 2024 | $2,996 | $159,700 | $28,000 | $131,700 |
| 2023 | $2,902 | $159,700 | $28,000 | $131,700 |
| 2022 | $2,880 | $130,600 | $23,400 | $107,200 |
| 2021 | $2,832 | $130,600 | $23,400 | $107,200 |
| 2020 | $2,952 | $118,200 | $21,100 | $97,100 |
| 2019 | $2,998 | $118,200 | $21,100 | $97,100 |
| 2018 | $2,934 | $110,800 | $19,300 | $91,500 |
| 2017 | $2,792 | $110,800 | $19,300 | $91,500 |
| 2016 | $2,648 | $102,300 | $17,600 | $84,700 |
| 2015 | $2,648 | $102,300 | $17,600 | $84,700 |
| 2014 | $2,398 | $95,700 | $16,100 | $79,600 |
Source: Public Records
Map
Nearby Homes
- 1129 64th St
- 6423 Carpenter Ave
- 1008 67th St
- 6750 School St Unit 206
- 6750 School St Unit 205
- 1236 63rd St
- 1206 68th St
- 6521 Elmcrest Dr
- 1303 68th St
- 5912 Rutland Dr
- 1304 60th St
- 6564 Colby Ave
- 6420 Center St
- 6330 Center St
- 6826 Colby Ave
- 1215 Merle Hay Rd
- 720 63rd St
- 1233 72nd St
- 1243 Merle Hay Rd
- 1506 64th St