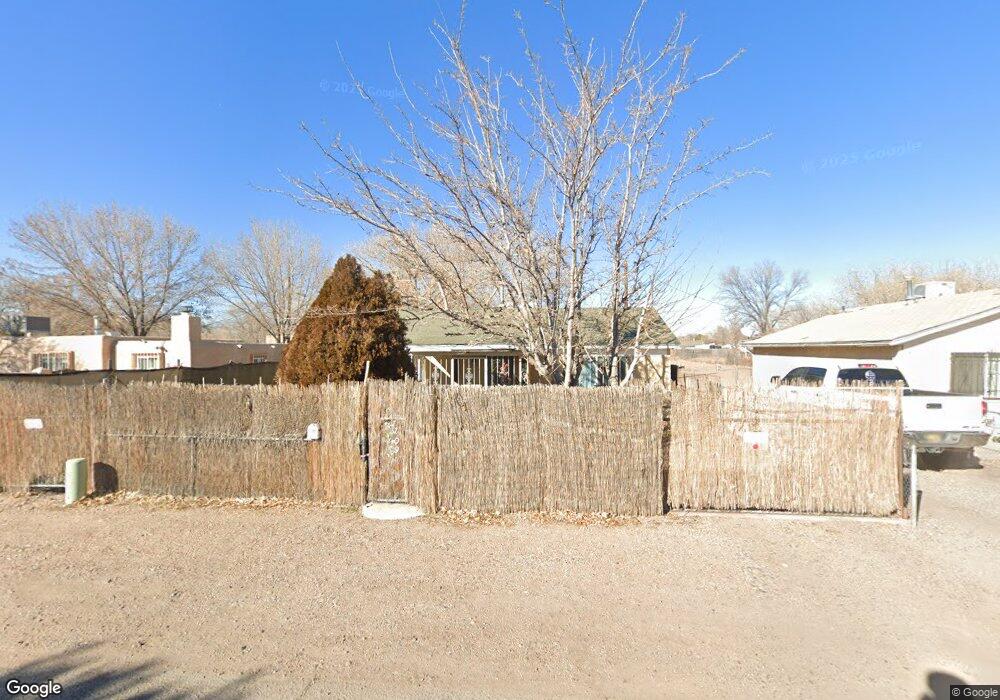
1109 Bletcher Rd SW Albuquerque, NM 87105
Estimated Value: $215,000 - $294,000
1
Bed
1
Bath
850
Sq Ft
$280/Sq Ft
Est. Value
About This Home
This home is located at 1109 Bletcher Rd SW, Albuquerque, NM 87105 and is currently estimated at $238,241, approximately $280 per square foot. 1109 Bletcher Rd SW is a home located in Bernalillo County with nearby schools including Armijo Elementary School, Ernie Pyle Middle School, and Rio Grande High School.
Ownership History
Date
Name
Owned For
Owner Type
Purchase Details
Closed on
Jul 20, 2018
Sold by
Dexel Christine P and Altobelli Rachel K
Bought by
Weidemann Tamryn Lee
Current Estimated Value
Home Financials for this Owner
Home Financials are based on the most recent Mortgage that was taken out on this home.
Original Mortgage
$72,000
Outstanding Balance
$62,399
Interest Rate
4.5%
Mortgage Type
New Conventional
Estimated Equity
$175,842
Purchase Details
Closed on
Oct 22, 2012
Sold by
Dexel Christine P
Bought by
Dexel Christine P and Altobelli Rachel K
Home Financials for this Owner
Home Financials are based on the most recent Mortgage that was taken out on this home.
Original Mortgage
$84,310
Interest Rate
3.75%
Mortgage Type
FHA
Purchase Details
Closed on
Dec 12, 2008
Sold by
Sedillo Gregorita
Bought by
Dexel Christine P
Home Financials for this Owner
Home Financials are based on the most recent Mortgage that was taken out on this home.
Original Mortgage
$88,827
Interest Rate
6.48%
Mortgage Type
FHA
Create a Home Valuation Report for This Property
The Home Valuation Report is an in-depth analysis detailing your home's value as well as a comparison with similar homes in the area
Home Values in the Area
Average Home Value in this Area
Purchase History
| Date | Buyer | Sale Price | Title Company |
|---|---|---|---|
| Weidemann Tamryn Lee | -- | Stewart Title | |
| Dexel Christine P | -- | Old Republic National Title | |
| Dexel Christine P | -- | Fidelity Natl Title Ins Co |
Source: Public Records
Mortgage History
| Date | Status | Borrower | Loan Amount |
|---|---|---|---|
| Open | Weidemann Tamryn Lee | $72,000 | |
| Previous Owner | Dexel Christine P | $84,310 | |
| Previous Owner | Dexel Christine P | $88,827 |
Source: Public Records
Tax History Compared to Growth
Tax History
| Year | Tax Paid | Tax Assessment Tax Assessment Total Assessment is a certain percentage of the fair market value that is determined by local assessors to be the total taxable value of land and additions on the property. | Land | Improvement |
|---|---|---|---|---|
| 2024 | $1,224 | $34,966 | $18,314 | $16,652 |
| 2023 | $1,199 | $33,948 | $17,781 | $16,167 |
| 2022 | $1,127 | $32,960 | $17,263 | $15,697 |
| 2021 | $1,088 | $32,000 | $16,760 | $15,240 |
| 2020 | $1,066 | $31,068 | $16,272 | $14,796 |
| 2019 | $1,033 | $30,163 | $15,798 | $14,365 |
| 2018 | $1,047 | $30,163 | $15,798 | $14,365 |
| 2017 | $1,009 | $28,747 | $16,760 | $11,987 |
| 2016 | $971 | $27,097 | $15,798 | $11,299 |
| 2015 | $28,920 | $28,920 | $10,520 | $18,400 |
| 2014 | $987 | $28,078 | $10,214 | $17,864 |
| 2013 | -- | $27,261 | $9,917 | $17,344 |
Source: Public Records
Map
Nearby Homes
- 1109 Lovato Rd SW
- 1545 Feliz Ln SW
- 1567 Las Glorietas SW
- 308 La Vega Dr SW
- 1347 Young Ave SW
- 1233 Montrose Place SW
- 1116 Isleta Blvd SW
- 835 Armijo Rd SW
- 121 La Vega Dr SW
- 726 Riverside Dr SW
- 1816 San Ygnacio Rd SW
- 834 Riverside Dr SW
- 1101 Pear Dr SW
- 1319 La Vega Dr SW
- 1911 Poplar Ln SW
- 1516 1 2 Gallegos Rd SW
- 822 Lewis Ave SW
- 1427 Vito Romero Rd SW
- 501 Whitten Trail SW
- 711 Lewis Ave SW
- 1113 Bletcher Rd SW
- 1105 Bletcher Rd SW
- 1034 Bletcher Rd SW
- 1103 Bletcher Rd SW
- 1117 Bletcher Rd SW
- 1112 Bletcher Rd SW
- 1122 Bletcher Rd SW
- 1029 Bletcher Rd SW
- 1030 Bletcher Rd SW
- 1026 Bletcher Rd SW
- 1125 Bletcher Rd SW
- 1023 Bletcher Rd SW
- 1130 Bletcher Rd SW
- 1022 Bletcher Rd SW
- 1033 La Font Rd SW
- 1016 Bletcher Rd SW
- 1108 Waldie Rd SW
- 1005 Bletcher Rd SW
- 1032 Waldie Rd SW
- 1023 La Font Rd SW