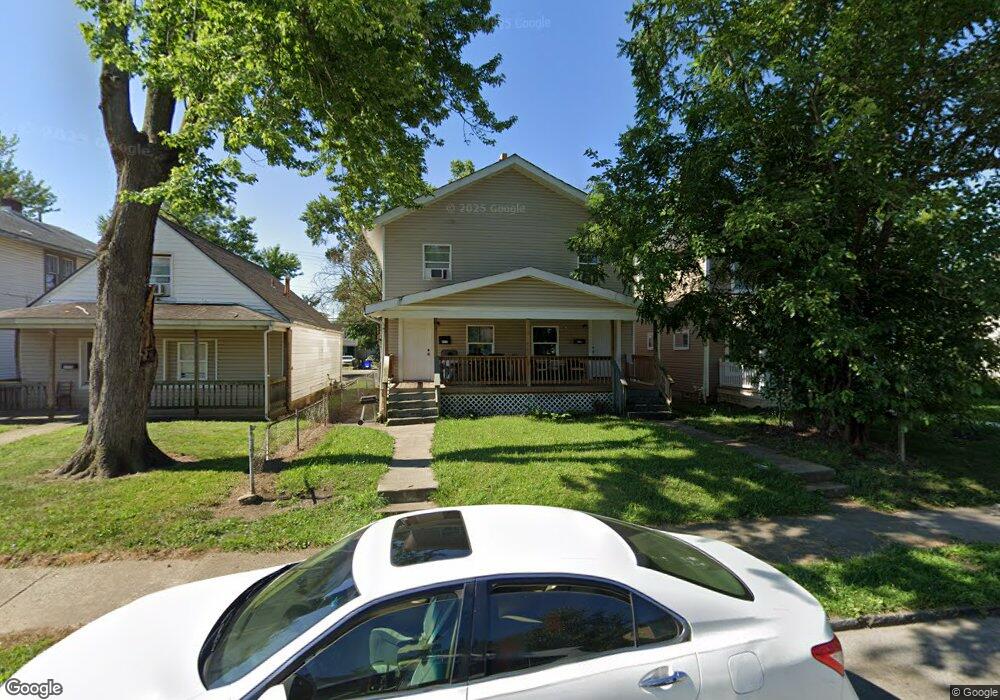
1109 E 18th Ave Unit 111 Columbus, OH 43211
South Linden NeighborhoodEstimated Value: $193,000 - $205,000
6
Beds
2
Baths
2,352
Sq Ft
$85/Sq Ft
Est. Value
About This Home
This home is located at 1109 E 18th Ave Unit 111, Columbus, OH 43211 and is currently estimated at $198,939, approximately $84 per square foot. 1109 E 18th Ave Unit 111 is a home located in Franklin County with nearby schools including Linden-Mckinley Stem School On Arcadia, North Columbus Preparatory Academy, and AchievePoint Career Academy - Columbus.
Ownership History
Date
Name
Owned For
Owner Type
Purchase Details
Closed on
Nov 5, 2018
Sold by
City Of Columbus Ohio
Bought by
Adumala Krishna
Current Estimated Value
Purchase Details
Closed on
Nov 13, 2017
Sold by
Central Ohio Community Improvment Corpo
Bought by
City Of Colombus Ohio and Ohio Muncipal Corporation
Purchase Details
Closed on
Jun 20, 2017
Sold by
Wb Property Investors Llc
Bought by
Central Ohio Comunity Improvment Corpora
Purchase Details
Closed on
Sep 16, 2005
Sold by
Morris Gregory J and Morris Emily
Bought by
Wb Property Investors Llc
Purchase Details
Closed on
Apr 29, 2003
Sold by
Hughes Thelma
Bought by
Morris Gregory J
Purchase Details
Closed on
Sep 10, 1987
Bought by
Hughes Thelma
Purchase Details
Closed on
Dec 1, 1984
Purchase Details
Closed on
Apr 1, 1984
Create a Home Valuation Report for This Property
The Home Valuation Report is an in-depth analysis detailing your home's value as well as a comparison with similar homes in the area
Home Values in the Area
Average Home Value in this Area
Purchase History
| Date | Buyer | Sale Price | Title Company |
|---|---|---|---|
| Adumala Krishna | -- | None Available | |
| City Of Colombus Ohio | -- | None Available | |
| Central Ohio Comunity Improvment Corpora | -- | None Available | |
| Wb Property Investors Llc | $57,000 | Worthington | |
| Morris Gregory J | $49,000 | Chicago Title | |
| Hughes Thelma | $29,000 | -- | |
| -- | $20,800 | -- | |
| -- | -- | -- |
Source: Public Records
Tax History
| Year | Tax Paid | Tax Assessment Tax Assessment Total Assessment is a certain percentage of the fair market value that is determined by local assessors to be the total taxable value of land and additions on the property. | Land | Improvement |
|---|---|---|---|---|
| 2025 | $3,056 | $66,680 | $5,150 | $61,530 |
| 2024 | $3,056 | $66,680 | $5,150 | $61,530 |
| 2023 | $3,018 | $66,675 | $5,145 | $61,530 |
| 2022 | $1,228 | $23,110 | $2,490 | $20,620 |
| 2021 | $911 | $17,120 | $2,490 | $14,630 |
| 2020 | $956 | $17,120 | $2,490 | $14,630 |
| 2019 | $120 | $14,250 | $2,070 | $12,180 |
| 2018 | $806 | $14,250 | $2,070 | $12,180 |
| 2017 | $0 | $14,250 | $2,070 | $12,180 |
| 2016 | $3,735 | $11,940 | $2,980 | $8,960 |
| 2015 | $1,450 | $11,940 | $2,980 | $8,960 |
| 2014 | $740 | $11,940 | $2,980 | $8,960 |
| 2013 | $478 | $13,230 | $3,290 | $9,940 |
Source: Public Records
Map
Nearby Homes
- 1129 E 17th Ave
- 1070 E 16th Ave
- 1111-1113 E 16th Ave
- 1673 Cleveland Ave
- 1037 E 18th Ave
- 1012 E 17th Ave
- 990 E 16th Ave
- 1045-1051 E 20th Ave
- 1705 Lexington Ave
- 957 E 17th Ave
- 1027 E 14th Ave
- 1136 E 21st Ave
- 1111 Windsor Ave
- 1121 Windsor Ave
- 914-916 E 17th Ave
- 1249-1251 E 15th Ave
- 1315 E 18th Ave
- 0 E 18th Ave
- 1218 E 22nd Ave
- 990 E 21st Ave
- 1109-1111 E 18th Ave
- 1103 E 18th Ave Unit 105
- 1103-1105 E 18th Ave
- 1115 E 18th Ave
- 1115 E 18th Ave
- 1119 E 18th Ave Unit 121
- 1119 E 18th Ave Unit 21
- 1095 E 18th Ave
- 1123 E 18th Ave
- 1089 E 18th Ave Unit 91
- 1127 E 18th Ave Unit 129
- 1127-1129 E 18th Ave
- 1102 E 17th Ave
- 1106 E 17th Ave Unit 108
- 1106-1108 E 17th Ave
- 1094 E 17th Ave
- 1085-1087 E 18th Ave
- 1110 E 17th Ave Unit 112
- 1110 E 17th Ave Unit 12
- 1133 E 18th Ave Unit 135
Your Personal Tour Guide
Ask me questions while you tour the home.