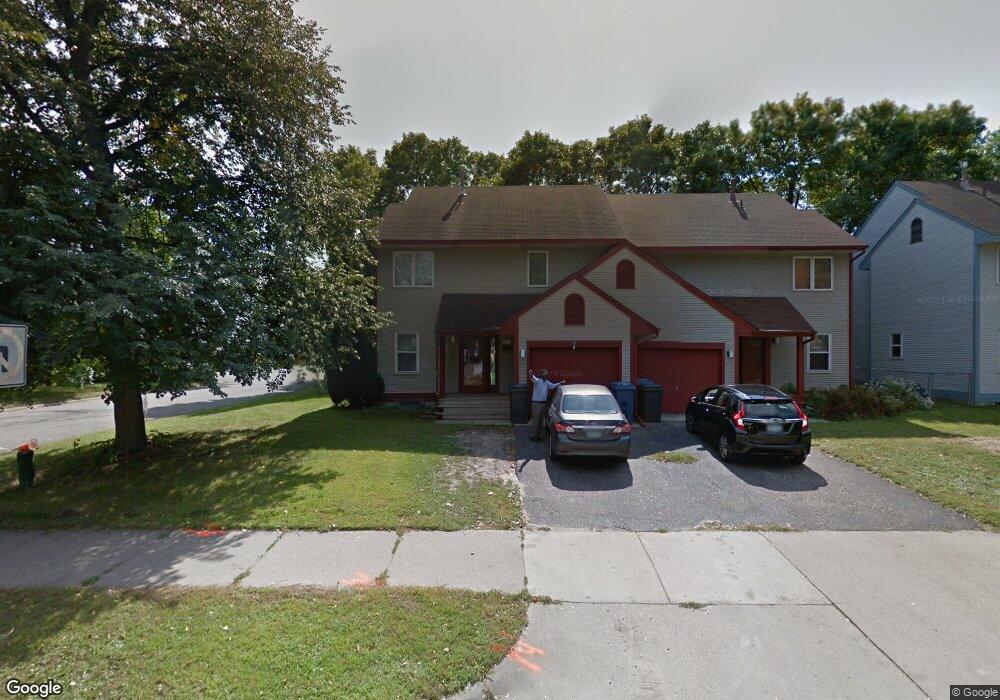
1109 E 22nd St Minneapolis, MN 55404
Ventura Village NeighborhoodEstimated Value: $275,000 - $302,369
5
Beds
2
Baths
1,328
Sq Ft
$221/Sq Ft
Est. Value
About This Home
This home is located at 1109 E 22nd St, Minneapolis, MN 55404 and is currently estimated at $292,842, approximately $220 per square foot. 1109 E 22nd St is a home located in Hennepin County with nearby schools including Andersen Middle, South Senior High School, and Augsburg Fairview Academy.
Ownership History
Date
Name
Owned For
Owner Type
Purchase Details
Closed on
May 6, 2015
Sold by
Engebretson Andrew and Engebretson Megan
Bought by
Mohamoud Hiat and Roble Ibrahim
Current Estimated Value
Home Financials for this Owner
Home Financials are based on the most recent Mortgage that was taken out on this home.
Original Mortgage
$112,000
Outstanding Balance
$41,576
Interest Rate
3.64%
Mortgage Type
Unknown
Estimated Equity
$251,266
Purchase Details
Closed on
Aug 15, 2005
Sold by
Boadu Andrew and Boadu Comfort
Bought by
Engebretson Andrew
Purchase Details
Closed on
Aug 11, 2001
Sold by
Khan Omer F
Bought by
Boadu Andrew
Purchase Details
Closed on
Aug 28, 1996
Sold by
Mgic
Bought by
Arneja Asha
Create a Home Valuation Report for This Property
The Home Valuation Report is an in-depth analysis detailing your home's value as well as a comparison with similar homes in the area
Home Values in the Area
Average Home Value in this Area
Purchase History
| Date | Buyer | Sale Price | Title Company |
|---|---|---|---|
| Mohamoud Hiat | $146,000 | Titlesmart Inc | |
| Engebretson Andrew | $174,000 | -- | |
| Boadu Andrew | $95,000 | -- | |
| Arneja Asha | $36,500 | -- |
Source: Public Records
Mortgage History
| Date | Status | Borrower | Loan Amount |
|---|---|---|---|
| Open | Mohamoud Hiat | $112,000 |
Source: Public Records
Tax History
| Year | Tax Paid | Tax Assessment Tax Assessment Total Assessment is a certain percentage of the fair market value that is determined by local assessors to be the total taxable value of land and additions on the property. | Land | Improvement |
|---|---|---|---|---|
| 2024 | $3,620 | $264,000 | $41,000 | $223,000 |
| 2023 | $2,849 | $233,000 | $41,000 | $192,000 |
| 2022 | $2,397 | $212,000 | $38,100 | $173,900 |
| 2021 | $2,318 | $191,000 | $38,100 | $152,900 |
| 2020 | $2,193 | $191,000 | $38,100 | $152,900 |
| 2019 | $1,716 | $170,500 | $38,100 | $132,400 |
| 2018 | $1,679 | $136,500 | $38,100 | $98,400 |
| 2017 | $1,871 | $121,500 | $38,100 | $83,400 |
| 2016 | $1,781 | $112,000 | $38,100 | $73,900 |
| 2015 | $1,874 | $100,000 | $38,100 | $61,900 |
| 2014 | -- | $100,000 | $38,100 | $61,900 |
Source: Public Records
Map
Nearby Homes
- 2211 10th Ave S
- 2100 14th Ave S
- 2206 Elliot Ave
- 2428 11th Ave S
- 1911 Elliot Ave
- 1903 Elliot Ave
- 2508 11th Ave S
- 2221 Bloomington Ave
- 1828 15th Ave S
- 1807 Elliot Ave Unit 4
- 1811 Elliot Ave Unit 2
- 1801 Elliot Ave Unit 5
- 2535 11th Ave S
- 2402 16th Ave S
- 2433 Columbus Ct
- 1912 Columbus Ave
- 2433 16th Ave S
- 1829 Park Ave Unit 7
- 2630 14th Ave S
- 2523 16th Ave S
- 1107 E 22nd St
- 1103 E 22nd St
- 2209 11th Ave S
- 1101 E 22nd St
- 2211 11th Ave S
- 2215 11th Ave S
- 1201 E 22nd St
- 2121 11th Ave S
- 1203 E 22nd St
- 2209 12th Ave S
- 2115 12th Ave S
- 2211 2211 12th-Avenue-s
- 2217 11th Ave S
- 1207 E 22nd St
- 2223 12th Ave S
- 2211 12th Ave S
- 2217 12th Ave S
- 2221 11th Ave S
- 2113 11th Ave S
- 1209 E 22nd St
Your Personal Tour Guide
Ask me questions while you tour the home.