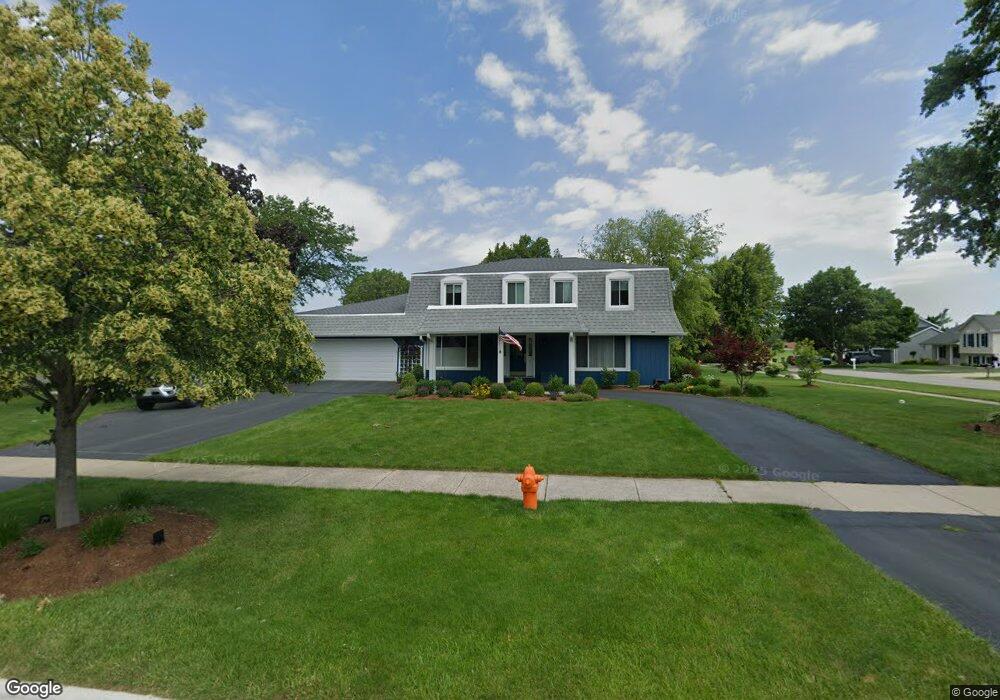
1109 E Bailey Rd Naperville, IL 60565
Signal Point NeighborhoodEstimated Value: $605,858 - $703,000
Studio
--
Bath
2,554
Sq Ft
$256/Sq Ft
Est. Value
About This Home
This home is located at 1109 E Bailey Rd, Naperville, IL 60565 and is currently estimated at $652,965, approximately $255 per square foot. 1109 E Bailey Rd is a home located in DuPage County with nearby schools including Scott Elementary School, Madison Jr High School, and Naperville Central High School.
Ownership History
Date
Name
Owned For
Owner Type
Purchase Details
Closed on
Oct 16, 2025
Sold by
Robert Jung Revocable Living Trust and Judith A Jung Revocable Living Trust
Bought by
Robert A Jung Trust and Judith A Jung Trust
Current Estimated Value
Purchase Details
Closed on
Jul 17, 2020
Sold by
Jung Robert and Jung Judith A
Bought by
Jung Robert and Jung Judith A
Home Financials for this Owner
Home Financials are based on the most recent Mortgage that was taken out on this home.
Original Mortgage
$343,475
Interest Rate
2.75%
Mortgage Type
FHA
Purchase Details
Closed on
Apr 28, 2017
Sold by
Jung Robert A
Bought by
Jung Robert and Robert Jung Revocable Living Turst
Purchase Details
Closed on
Mar 31, 2016
Sold by
Kuikman John and Kuikman Deborah
Bought by
Jung Robert A
Home Financials for this Owner
Home Financials are based on the most recent Mortgage that was taken out on this home.
Original Mortgage
$372,099
Interest Rate
3.5%
Mortgage Type
FHA
Purchase Details
Closed on
Jun 3, 2002
Sold by
Fredrickson Deborah L
Bought by
Kuikman John and Kuikman Deborah L
Home Financials for this Owner
Home Financials are based on the most recent Mortgage that was taken out on this home.
Original Mortgage
$258,500
Interest Rate
6.91%
Create a Home Valuation Report for This Property
The Home Valuation Report is an in-depth analysis detailing your home's value as well as a comparison with similar homes in the area
Home Values in the Area
Average Home Value in this Area
Purchase History
| Date | Buyer | Sale Price | Title Company |
|---|---|---|---|
| Robert A Jung Trust | -- | None Listed On Document | |
| Jung Robert | -- | Attorney | |
| Jung Robert | -- | Attorney | |
| Jung Robert A | $390,000 | Ctic | |
| Kuikman John | -- | Stewart Title Company |
Source: Public Records
Mortgage History
| Date | Status | Borrower | Loan Amount |
|---|---|---|---|
| Previous Owner | Jung Robert | $343,475 | |
| Previous Owner | Jung Robert A | $372,099 | |
| Previous Owner | Kuikman John | $258,500 |
Source: Public Records
Tax History
| Year | Tax Paid | Tax Assessment Tax Assessment Total Assessment is a certain percentage of the fair market value that is determined by local assessors to be the total taxable value of land and additions on the property. | Land | Improvement |
|---|---|---|---|---|
| 2024 | $10,131 | $173,373 | $69,566 | $103,807 |
| 2023 | $9,762 | $158,230 | $63,490 | $94,740 |
| 2022 | $9,328 | $150,130 | $60,240 | $89,890 |
| 2021 | $8,987 | $144,450 | $57,960 | $86,490 |
| 2020 | $8,795 | $141,860 | $56,920 | $84,940 |
| 2019 | $8,539 | $135,730 | $54,460 | $81,270 |
| 2018 | $8,541 | $135,730 | $54,460 | $81,270 |
| 2017 | $8,369 | $131,150 | $52,620 | $78,530 |
| 2016 | $8,202 | $126,410 | $50,720 | $75,690 |
| 2015 | $8,149 | $119,040 | $47,760 | $71,280 |
| 2014 | $8,208 | $116,270 | $45,700 | $70,570 |
| 2013 | $8,084 | $116,550 | $45,810 | $70,740 |
Source: Public Records
Map
Nearby Homes
- 1255 E Bailey Rd
- 1613 Fairway Ln
- 1405 E Bailey Rd
- 1404 Chelsea Ln
- 1007 River Oak Dr
- 1653 Kenyon Dr
- 1449 Whitespire Ct Unit 5104
- 1546 Treeline Ct Unit 405
- 510 Harlowe Ln Unit 2001C
- 538 Harlowe Ln Unit 1801
- 627 Bourbon Ct
- 621 Bourbon Ct
- 613 Bourbon Ct
- 1909 Montclair Dr
- 1583 Orchard Cir
- 1723 Napoleon Dr
- 1333 Purdue Ave
- 8S452 Bell Dr
- 1710 Coach Dr
- 1864 Slippery Rock Rd
- 1545 Fender Rd
- 1105 E Bailey Rd
- 1019 E Bailey Rd
- 1541 Fender Rd
- 1108 E Bailey Rd
- 1104 E Bailey Rd
- 1608 Fender Rd
- 1250 E Bailey Rd
- 1017 E Bailey Rd
- 1609 Fender Rd
- 1533 Fender Rd Unit 4
- 1604 Fender Rd
- 1608 Fairway Ln
- 1600 Fender Rd
- 1301 E Bailey Rd
- 1015 E Bailey Rd
- 1300 Auburn Ave
- 1529 Fender Rd Unit 4
- 1613 Fender Rd
- 1013 E Bailey Rd
Your Personal Tour Guide
Ask me questions while you tour the home.