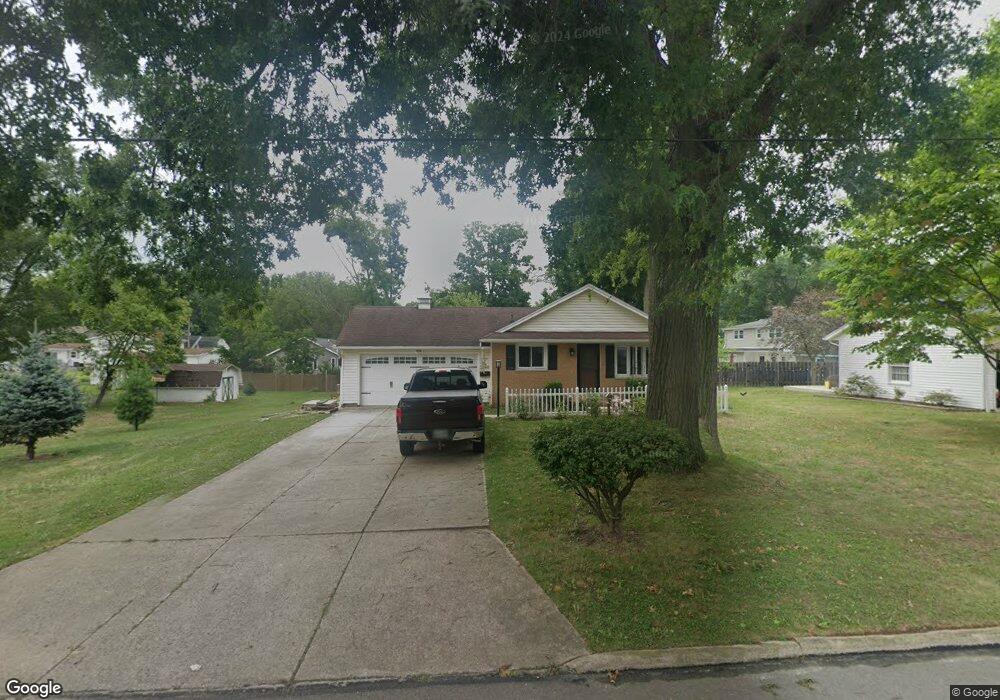
1109 Edgehill Ave Ashland, OH 44805
Estimated Value: $186,000 - $243,000
2
Beds
1
Bath
1,092
Sq Ft
$195/Sq Ft
Est. Value
About This Home
This home is located at 1109 Edgehill Ave, Ashland, OH 44805 and is currently estimated at $213,460, approximately $195 per square foot. 1109 Edgehill Ave is a home located in Ashland County with nearby schools including Ashland High School, Ashland County Community Academy, and St. Edward Elementary School.
Ownership History
Date
Name
Owned For
Owner Type
Purchase Details
Closed on
May 21, 2024
Sold by
Goldsmith Charles B and Goldsmith Michelle L
Bought by
Chambers Shane T
Current Estimated Value
Home Financials for this Owner
Home Financials are based on the most recent Mortgage that was taken out on this home.
Original Mortgage
$185,576
Outstanding Balance
$183,081
Interest Rate
7.1%
Mortgage Type
FHA
Estimated Equity
$30,379
Purchase Details
Closed on
Mar 17, 2016
Sold by
Wacker Russell E Trust
Bought by
Goldsmith Charles B and Sheehan Michelle L
Home Financials for this Owner
Home Financials are based on the most recent Mortgage that was taken out on this home.
Original Mortgage
$112,080
Interest Rate
3.72%
Mortgage Type
VA
Purchase Details
Closed on
Nov 2, 2007
Bought by
Wacker Russell E
Purchase Details
Closed on
Jul 6, 1999
Sold by
Mcquate Pamela
Bought by
Wacker Russell E
Purchase Details
Closed on
Jan 1, 1990
Bought by
Mcquate Pamela
Create a Home Valuation Report for This Property
The Home Valuation Report is an in-depth analysis detailing your home's value as well as a comparison with similar homes in the area
Home Values in the Area
Average Home Value in this Area
Purchase History
| Date | Buyer | Sale Price | Title Company |
|---|---|---|---|
| Chambers Shane T | $189,000 | Castle Real Estate Title | |
| Goldsmith Charles B | $108,500 | Ashland Title Agcy | |
| Wacker Russell E | -- | -- | |
| Wacker Russell E | $93,000 | -- | |
| Mcquate Pamela | -- | -- |
Source: Public Records
Mortgage History
| Date | Status | Borrower | Loan Amount |
|---|---|---|---|
| Open | Chambers Shane T | $185,576 | |
| Previous Owner | Goldsmith Charles B | $112,080 |
Source: Public Records
Tax History Compared to Growth
Tax History
| Year | Tax Paid | Tax Assessment Tax Assessment Total Assessment is a certain percentage of the fair market value that is determined by local assessors to be the total taxable value of land and additions on the property. | Land | Improvement |
|---|---|---|---|---|
| 2024 | $1,579 | $55,530 | $12,840 | $42,690 |
| 2023 | $1,579 | $55,530 | $12,840 | $42,690 |
| 2022 | $1,349 | $39,660 | $9,170 | $30,490 |
| 2021 | $1,355 | $39,660 | $9,170 | $30,490 |
| 2020 | $1,283 | $39,660 | $9,170 | $30,490 |
| 2019 | $1,144 | $34,260 | $8,650 | $25,610 |
| 2018 | $1,586 | $34,260 | $8,650 | $25,610 |
| 2017 | $1,592 | $34,260 | $8,650 | $25,610 |
| 2016 | $1,127 | $32,620 | $8,230 | $24,390 |
| 2015 | $1,117 | $32,620 | $8,230 | $24,390 |
| 2013 | $1,148 | $32,410 | $8,270 | $24,140 |
Source: Public Records
Map
Nearby Homes
- 453 Hillcrest Dr
- 1109 Eastern Ave
- 855 Eastern Ave
- 721 Heltman Ave
- 31 Morgan Ave
- 207 Samaritan Ave
- 421 Center St
- 219 W Washington St
- 347 E 4th St
- 517 E 5th St
- 531 Keen Ave
- 1435 Township Road 843
- 427 W Main St
- 1457 Township Road 853
- 0 Eagle Way
- 1026 Claremont Ave
- 325 W 4th St
- 323 W 4th St
- 945 Virginia Ave
- 912 Berry Ave
- 1109 Edgehill Ave
- 504 Hillcrest Dr
- 512 Hillcrest Dr
- 1019 Edgehill Ave
- 452 Hillcrest Dr
- 453 Forestdale Rd
- 524 Hillcrest Dr
- 1102 Mount Auburn Dr
- 1020 Mount Auburn Dr
- 1015 Edgehill Ave
- 445 Forestdale Rd
- 444 Hillcrest Dr
- 1020 Edgehill Ave
- 1115 Mount Auburn Dr
- 1007 Edgehill Ave
- 1135 Edgehill Ave
- 1010 Mount Auburn Dr
- 525 Hillcrest Dr
- 442 Forestdale Rd
- 437 Forestdale Rd