1109 Ellison Park Cir Denton, TX 76205
South Denton NeighborhoodEstimated Value: $384,792 - $425,000
3
Beds
2
Baths
1,985
Sq Ft
$203/Sq Ft
Est. Value
About This Home
This home is located at 1109 Ellison Park Cir, Denton, TX 76205 and is currently estimated at $402,948, approximately $202 per square foot. 1109 Ellison Park Cir is a home located in Denton County with nearby schools including Houston Elementary School, McMath Middle School, and Denton High School.
Ownership History
Date
Name
Owned For
Owner Type
Purchase Details
Closed on
Apr 5, 2016
Sold by
Vanderlaan David and Vanderlaan Debbie
Bought by
House Karen A
Current Estimated Value
Home Financials for this Owner
Home Financials are based on the most recent Mortgage that was taken out on this home.
Original Mortgage
$220,000
Outstanding Balance
$173,477
Interest Rate
3.62%
Mortgage Type
New Conventional
Estimated Equity
$229,471
Purchase Details
Closed on
Dec 30, 2011
Sold by
Blankenship Claudette
Bought by
Vanderlaan David and Vanderlaan Debbie
Home Financials for this Owner
Home Financials are based on the most recent Mortgage that was taken out on this home.
Original Mortgage
$140,000
Interest Rate
4.03%
Mortgage Type
New Conventional
Purchase Details
Closed on
Jul 31, 2002
Sold by
Maxwell Sherri
Bought by
Caplinger June and Colbert Elizabeth A
Purchase Details
Closed on
Jun 13, 2000
Sold by
Talley Claudine A
Bought by
Talley Living Trust
Purchase Details
Closed on
Apr 17, 2000
Sold by
Moore Rickie E
Bought by
Talley Claudine A
Create a Home Valuation Report for This Property
The Home Valuation Report is an in-depth analysis detailing your home's value as well as a comparison with similar homes in the area
Home Values in the Area
Average Home Value in this Area
Purchase History
| Date | Buyer | Sale Price | Title Company |
|---|---|---|---|
| House Karen A | -- | Title Resources | |
| Vanderlaan David | -- | Title Resources Of North Tex | |
| Caplinger June | -- | -- | |
| Caplinger June | -- | -- | |
| Talley Living Trust | -- | -- | |
| Talley Living Trust | -- | -- | |
| Talley Claudine A | -- | -- |
Source: Public Records
Mortgage History
| Date | Status | Borrower | Loan Amount |
|---|---|---|---|
| Open | House Karen A | $220,000 | |
| Previous Owner | Vanderlaan David | $140,000 |
Source: Public Records
Tax History Compared to Growth
Tax History
| Year | Tax Paid | Tax Assessment Tax Assessment Total Assessment is a certain percentage of the fair market value that is determined by local assessors to be the total taxable value of land and additions on the property. | Land | Improvement |
|---|---|---|---|---|
| 2025 | $4,493 | $324,174 | $67,390 | $342,362 |
| 2024 | $5,688 | $294,704 | $0 | $0 |
| 2023 | $3,919 | $267,913 | $67,390 | $373,884 |
| 2022 | $5,170 | $243,557 | $67,390 | $242,840 |
| 2021 | $4,922 | $221,415 | $50,860 | $170,555 |
| 2020 | $5,919 | $258,937 | $50,860 | $208,077 |
| 2019 | $6,234 | $261,275 | $50,860 | $210,415 |
| 2018 | $5,989 | $247,917 | $40,688 | $207,229 |
| 2017 | $6,142 | $248,503 | $40,688 | $207,815 |
| 2016 | $5,380 | $217,657 | $33,059 | $184,598 |
| 2015 | $4,655 | $203,297 | $33,059 | $170,238 |
| 2014 | $4,655 | $186,044 | $32,640 | $153,404 |
| 2013 | -- | $163,587 | $32,640 | $130,947 |
Source: Public Records
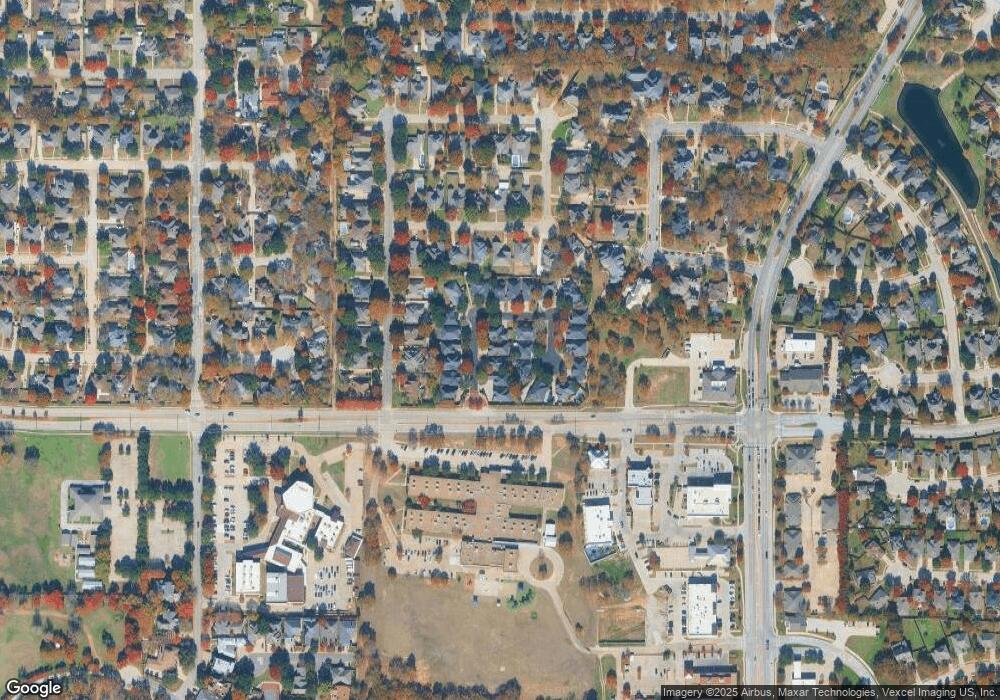
Map
Nearby Homes
- 1108 Ellison Park Cir
- 720 Smokerise Cir
- 1012 Indian Ridge Dr
- 916 Smokerise Cir
- 2000 Lamprey Cir
- 2009 Lake Fork Ct
- 1000 Lynhurst Ln
- 816 Chapel Dr
- 824 Sandpiper Dr
- 821 Sandpiper Dr
- 829 Skylark Dr
- 2209 Loon Lake Rd
- 2253 Hollyhill Ln
- 2272 Hollyhill Ln
- 2226 Savannah Trail
- 2312 Caddo Cir
- 924 Ridgecrest Cir
- 3432 Sundown Blvd
- 2216 Jefferson Trail
- 2544 Natchez Trace
- 1113 Ellison Park Cir
- 1105 Ellison Park Cir
- 909 Ellison Park Cir
- 1117 Ellison Park Cir
- 905 Ellison Park Cir
- 913 Ellison Park Cir
- 1121 Ellison Park Cir
- 1112 Ellison Park Cir
- 1104 Ellison Park Cir
- 1116 Ellison Park Cir
- 1100 Ellison Park Cir
- 901 Ellison Park Cir
- 1012 Ellison Park Cir
- 1008 Ellison Park Cir
- 1016 Ellison Park Cir
- 1120 Ellison Park Cir
- 1004 Ellison Park Cir
- 1020 Ellison Park Cir
- 1000 Ellison Park Cir
- 1117 Indian Ridge Dr