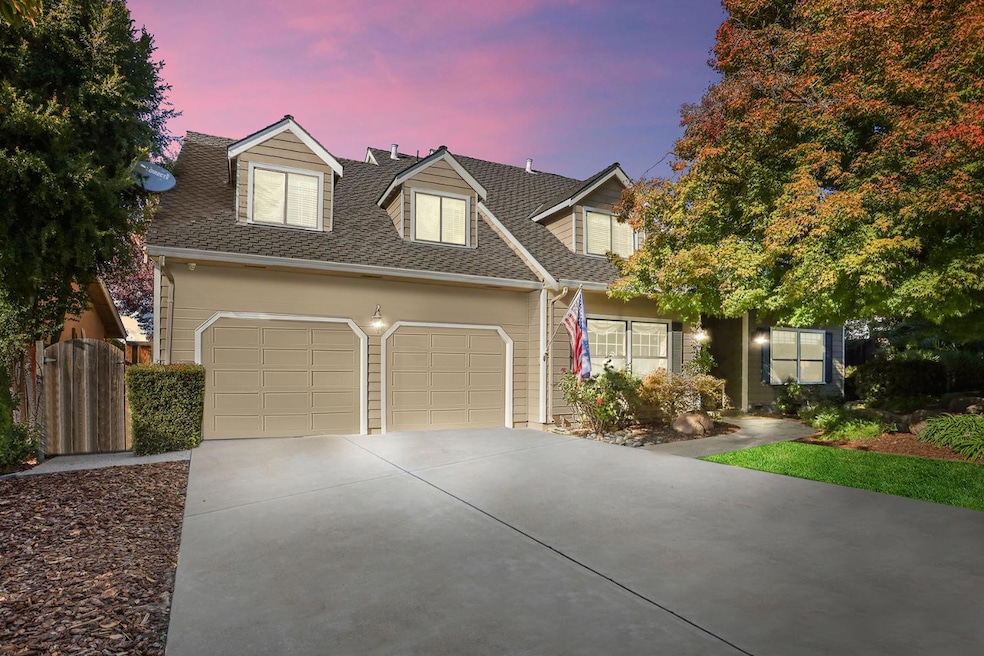
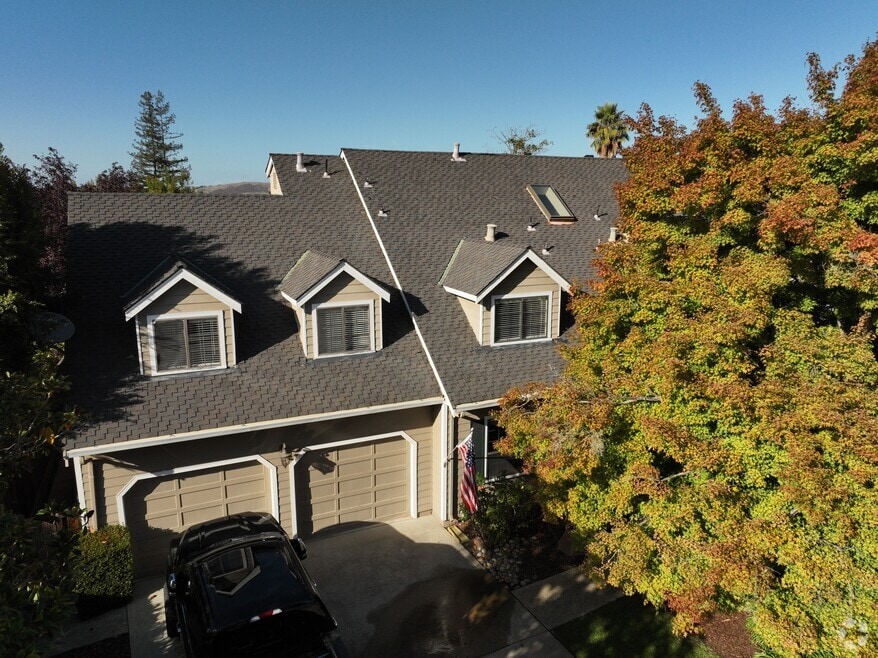
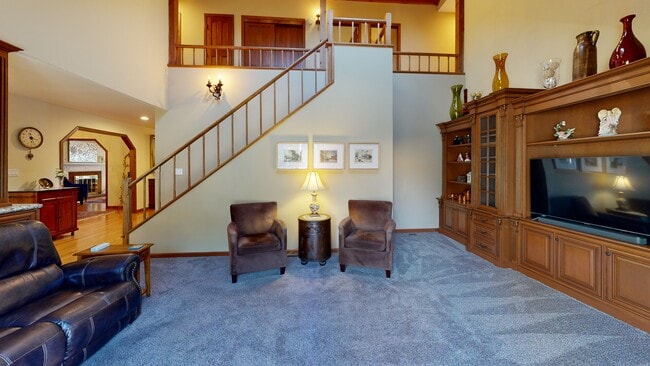
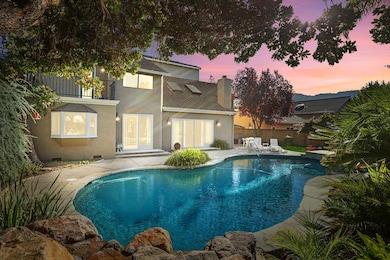
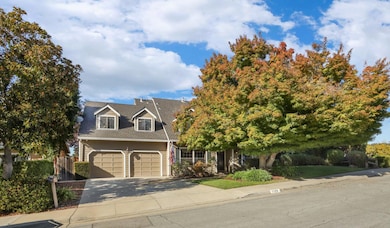
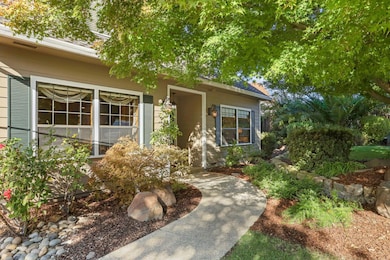
NOT LISTED FOR SALE

Estimated Value: $2,860,000 - $2,957,000

5 Beds
3 Baths
3,202 Sq Ft
$908/Sq Ft Est. Value

About This Home

This home is located at 1109 Foxhurst Way, San Jose, CA 95120 and is currently estimated at $2,905,828, approximately $907 per square foot. 1109 Foxhurst Way is a home located in Santa Clara County with nearby schools including Williams Elementary School, Bret Harte Middle School, and Leland High School.

Ownership History

Date Name Owned For Owner Type

Purchase Details

Closed on
Oct 11, 2021
Sold by
Adams Wanda Mae
Bought by
Adams Wanda Mae and The Wanda Mae Adams Trust
Current Estimated Value
$2,905,828

Purchase Details

Closed on
Jun 9, 2020
Sold by
Bole James A and Bole Pamela B
Bought by
Adams Wanda Mae

Home Financials for this Owner

Home Financials are based on the most recent Mortgage that was taken out on this home.
Original Mortgage
$1,396,500
Outstanding Balance
$1,241,577
Interest Rate
3%
Mortgage Type
New Conventional
Estimated Equity
$1,701,089

Purchase Details

Closed on
Mar 22, 1994
Sold by
Sostchen Gary Y and Sostchen Ellen B
Bought by
Bole James A and Bole Pamela B

Home Financials for this Owner

Home Financials are based on the most recent Mortgage that was taken out on this home.
Original Mortgage
$370,000
Interest Rate
3.37%
Source: Public Records

Range of Values:

Collateral Analytics

Collateral Analytics Collateral Analytics AVMs (Automated Valuation Model) employ a number of statistical approaches combined with neighborhood-specific comparable selection guarantees the most up-to-date and precise valuations.

Not Available

Collateral Analytics does not have data for the current month. Please view the chart for historical values.

ICE

ICE Mortgage Technology ICE Mortgage Technology’s AVM (Automated Valuation Model) is a state-of-the-art online residential property valuation tool that provides a quick and accurate estimate of the value of almost any home in the U.S.

Not Available

ICE Mortgage Technology does not have data for the current month. Please view the chart for historical values.

First American

First American First American Data & Analytics’ next-generation AVM combines unrivaled data assets with a blended ensemble of valuation models to produce highly accurate, reliable valuations you can trust.

Not Available

First American does not have data for the current month. Please view the chart for historical values.

Quantarium

Quantarium Quantarium’s valuation service, repeatedly proven the industry’s most accurate and comprehensive, is supercharged with a self-learning and auto-tuning AI engine that continually becomes smarter and more accurate as it processes daily inputs from the industry’s leading RE data lake.

Not Available

Quantarium does not have data for the current month. Please view the chart for historical values.

Average Value
Not Available
List Price
Sold Price
Create a Home Valuation Report for This Property
The Home Valuation Report is an in-depth analysis detailing your home's value as well as a comparison with similar homes in the area

Home Values in the Area

Source: Public Records

Average Home Value in this Area


Source: Public Records

Purchase History

Date Buyer Sale Price Title Company
Adams Wanda Mae -- None Available
Adams Wanda Mae $1,995,000 Old Republic Title Company
Bole James A $495,000 All Cal Title Company
Source: Public Records

Mortgage History

Date Status Borrower Loan Amount
Previous Owner Bole James A $370,000
Source: Public Records

Tax History Compared to Growth

Source: Public Records

Tax History

Year Tax Paid Tax Assessment Tax Assessment Total Assessment is a certain percentage of the fair market value that is determined by local assessors to be the total taxable value of land and additions on the property. Land Improvement
2025 $26,131 $2,181,818 $1,745,456 $436,362
2024 $26,131 $2,139,038 $1,711,232 $427,806
2023 $25,693 $2,097,097 $1,677,679 $419,418
2022 $25,392 $2,055,979 $1,644,784 $411,195
2021 $24,951 $2,015,667 $1,612,534 $403,133
2020 $10,404 $787,663 $310,819 $476,844
2019 $10,179 $772,220 $304,725 $467,495
2018 $10,074 $757,079 $298,750 $458,329
2017 $9,990 $742,236 $292,893 $449,343
2016 $9,806 $727,683 $287,150 $440,533
2015 $9,740 $716,753 $282,837 $433,916
2014 $9,283 $702,714 $277,297 $425,417
Source: Public Records

Map