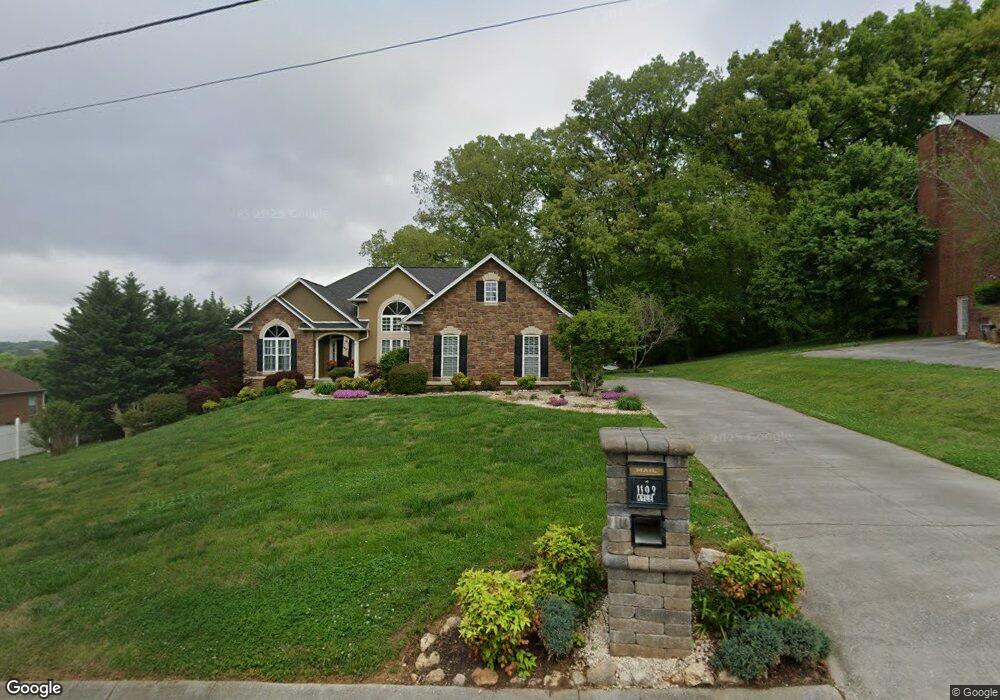
1109 Hickory View Dr Morristown, TN 37814
Estimated Value: $329,000 - $511,000
--
Bed
3
Baths
1,914
Sq Ft
$227/Sq Ft
Est. Value
About This Home
This home is located at 1109 Hickory View Dr, Morristown, TN 37814 and is currently estimated at $435,360, approximately $227 per square foot. 1109 Hickory View Dr is a home located in Hamblen County with nearby schools including Manley Elementary School, West View Middle School, and Morristown West High School.
Ownership History
Date
Name
Owned For
Owner Type
Purchase Details
Closed on
Dec 14, 2006
Sold by
Royston Chad E
Bought by
Kyle Randall S
Current Estimated Value
Home Financials for this Owner
Home Financials are based on the most recent Mortgage that was taken out on this home.
Original Mortgage
$196,000
Outstanding Balance
$121,545
Interest Rate
6.19%
Estimated Equity
$313,815
Purchase Details
Closed on
Aug 1, 2003
Sold by
Collins W Douglas
Bought by
Royston Chad E
Home Financials for this Owner
Home Financials are based on the most recent Mortgage that was taken out on this home.
Original Mortgage
$188,000
Interest Rate
4.25%
Purchase Details
Closed on
May 24, 1999
Sold by
Malone Keith
Bought by
Douglas Collins W
Purchase Details
Closed on
Nov 25, 1996
Sold by
Reneau Larry D and Holt Rose
Bought by
Keith Malone
Purchase Details
Closed on
Jun 30, 1993
Bought by
Jenkins Tom A and Reneau Larry D
Purchase Details
Closed on
Jul 17, 1992
Bought by
Jenkins Tom A and Reneau Larry D
Purchase Details
Closed on
May 15, 1944
Bought by
Murrell Murrell J and Murrell Ruth
Create a Home Valuation Report for This Property
The Home Valuation Report is an in-depth analysis detailing your home's value as well as a comparison with similar homes in the area
Home Values in the Area
Average Home Value in this Area
Purchase History
| Date | Buyer | Sale Price | Title Company |
|---|---|---|---|
| Kyle Randall S | $245,000 | -- | |
| Royston Chad E | $235,000 | -- | |
| Douglas Collins W | $207,000 | -- | |
| Keith Malone | $185,700 | -- | |
| Jenkins Tom A | -- | -- | |
| Murrell Melville C | -- | -- | |
| Jenkins Tom A | -- | -- | |
| Murrell Murrell J | -- | -- |
Source: Public Records
Mortgage History
| Date | Status | Borrower | Loan Amount |
|---|---|---|---|
| Open | Murrell Murrell J | $196,000 | |
| Previous Owner | Murrell Murrell J | $188,000 |
Source: Public Records
Tax History Compared to Growth
Tax History
| Year | Tax Paid | Tax Assessment Tax Assessment Total Assessment is a certain percentage of the fair market value that is determined by local assessors to be the total taxable value of land and additions on the property. | Land | Improvement |
|---|---|---|---|---|
| 2024 | $1,431 | $72,625 | $8,600 | $64,025 |
| 2023 | $1,431 | $72,625 | $0 | $0 |
| 2022 | $1,431 | $72,625 | $8,600 | $64,025 |
| 2021 | $1,431 | $72,625 | $8,600 | $64,025 |
| 2020 | $1,431 | $72,625 | $8,600 | $64,025 |
| 2019 | $1,290 | $60,575 | $7,625 | $52,950 |
| 2018 | $1,290 | $60,575 | $7,625 | $52,950 |
| 2017 | $1,290 | $60,575 | $7,625 | $52,950 |
| 2016 | $1,205 | $60,575 | $7,625 | $52,950 |
| 2015 | $1,121 | $60,575 | $7,625 | $52,950 |
| 2014 | -- | $60,575 | $7,625 | $52,950 |
| 2013 | -- | $69,975 | $0 | $0 |
Source: Public Records
Map
Nearby Homes
- 1121 Hickory View Dr
- 1074 Hickory View Dr
- 1013 Shadow Wood Ln
- 1031 Hickory View Dr
- 1025 Hickory View Dr
- 1465 Wind Crest Dr
- 5254 Rolling Springs Dr
- 1115 Millrace Rd
- 4537 Horseshoe Trail
- 4562 Horseshoe Trail
- 1406 Dandelion Cir
- 4193 Scarlett Dr
- 1466 Dandelion Cir
- 715* Benjamin Blvd
- 994 Pinewood Cir
- 665 Pinewood Cir
- 640 Pinewood Cir
- 621 Benjamin Blvd
- 615 Benjamin Blvd
- 1779 Seven Oaks Dr
- 1115 Hickory View Dr
- 1103 Hickory View Dr
- 4812 Walnut Hill Dr
- 4806 Walnut Hill Dr
- 1108 Hickory View Dr
- 1114 Hickory View Dr
- 1100 Hickory View Dr
- 1120 Hickory View Dr
- 1408 Hickory Shadow Dr
- 1127 Hickory View Dr
- 1094 Hickory View Dr
- 4830 Walnut Hill Dr
- 1126 Hickory View Dr
- 1418 Hickory Shadow Dr
- 1086 Hickory View Dr
- 1133 Hickory View Dr
- 1401 Hickory Shadow Dr
- 1043 Shadow Wood Ln
- 4836 Walnut Hill Dr
- 1132 Hickory View Dr