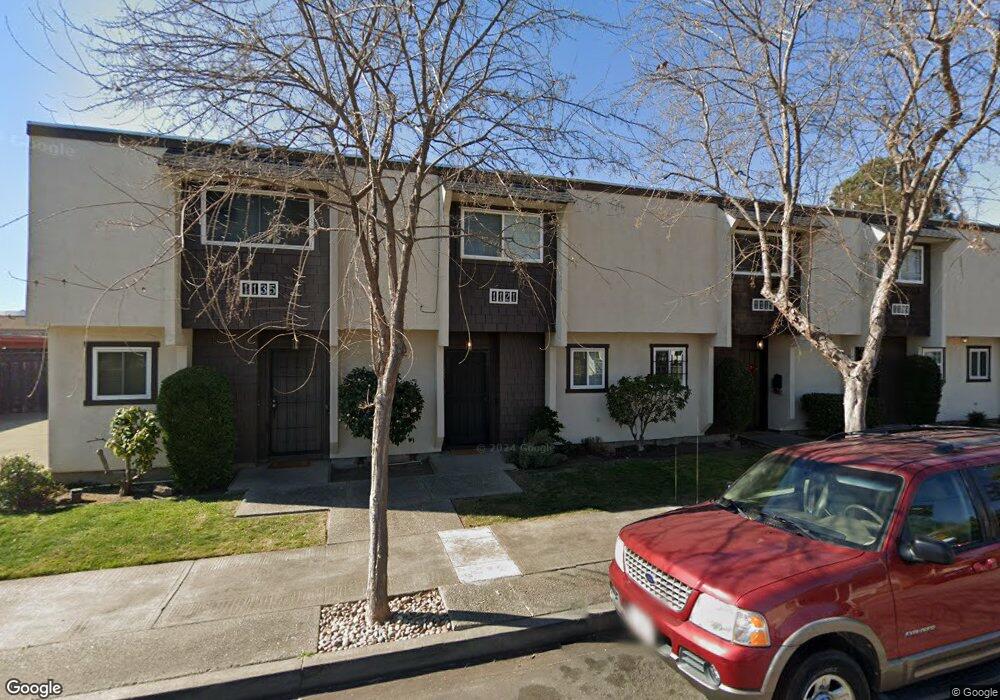
1109 Jefferson St Unit 2 San Leandro, CA 94577
Old San Leandro NeighborhoodEstimated Value: $422,000 - $547,000
2
Beds
2
Baths
1,112
Sq Ft
$423/Sq Ft
Est. Value
About This Home
This home is located at 1109 Jefferson St Unit 2, San Leandro, CA 94577 and is currently estimated at $470,611, approximately $423 per square foot. 1109 Jefferson St Unit 2 is a home located in Alameda County with nearby schools including Washington Elementary School, Bancroft Middle School, and San Leandro High School.
Ownership History
Date
Name
Owned For
Owner Type
Purchase Details
Closed on
Aug 19, 2005
Sold by
Ly Phat Dan and Fong Sau Nor
Bought by
Ly Phat Dan and Fong Sau Nor
Current Estimated Value
Home Financials for this Owner
Home Financials are based on the most recent Mortgage that was taken out on this home.
Original Mortgage
$238,000
Outstanding Balance
$124,623
Interest Rate
5.61%
Mortgage Type
Stand Alone Refi Refinance Of Original Loan
Estimated Equity
$345,988
Purchase Details
Closed on
Jul 29, 2003
Sold by
Ponte Silvia Monica and Soares Silva M
Bought by
Ly Phat Dan and Fong Sau Nor
Home Financials for this Owner
Home Financials are based on the most recent Mortgage that was taken out on this home.
Original Mortgage
$243,000
Interest Rate
6.25%
Mortgage Type
Purchase Money Mortgage
Purchase Details
Closed on
Jun 30, 2003
Sold by
Ponte Joao Carlos and Ponte Maria Carnezinda
Bought by
Ponte Silvia Monica
Home Financials for this Owner
Home Financials are based on the most recent Mortgage that was taken out on this home.
Original Mortgage
$243,000
Interest Rate
6.25%
Mortgage Type
Purchase Money Mortgage
Purchase Details
Closed on
Jan 11, 2000
Sold by
Ponte Joao C and Mezi Maria
Bought by
Ponte Silvia Monica
Purchase Details
Closed on
Aug 25, 1994
Sold by
Soares Silvia Monica and Soares Eduardo M
Bought by
Soares Silvia M and Ponte Joao Carlos
Create a Home Valuation Report for This Property
The Home Valuation Report is an in-depth analysis detailing your home's value as well as a comparison with similar homes in the area
Home Values in the Area
Average Home Value in this Area
Purchase History
| Date | Buyer | Sale Price | Title Company |
|---|---|---|---|
| Ly Phat Dan | -- | Chicago Title Co | |
| Ly Phat Dan | $270,000 | Ticor Title Company Of Ca | |
| Ponte Silvia Monica | -- | -- | |
| Ponte Silvia Monica | -- | -- | |
| Soares Silvia M | -- | -- |
Source: Public Records
Mortgage History
| Date | Status | Borrower | Loan Amount |
|---|---|---|---|
| Open | Ly Phat Dan | $238,000 | |
| Closed | Ly Phat Dan | $243,000 |
Source: Public Records
Tax History
| Year | Tax Paid | Tax Assessment Tax Assessment Total Assessment is a certain percentage of the fair market value that is determined by local assessors to be the total taxable value of land and additions on the property. | Land | Improvement |
|---|---|---|---|---|
| 2025 | $5,495 | $383,861 | $115,158 | $268,703 |
| 2024 | $5,495 | $376,336 | $112,901 | $263,435 |
| 2023 | $5,431 | $368,957 | $110,687 | $258,270 |
| 2022 | $5,280 | $361,724 | $108,517 | $253,207 |
| 2021 | $5,098 | $354,633 | $106,390 | $248,243 |
| 2020 | $4,949 | $351,000 | $105,300 | $245,700 |
| 2019 | $4,807 | $344,117 | $103,235 | $240,882 |
| 2018 | $4,672 | $337,370 | $101,211 | $236,159 |
| 2017 | $4,598 | $330,754 | $99,226 | $231,528 |
| 2016 | $4,363 | $324,270 | $97,281 | $226,989 |
| 2015 | $4,063 | $300,000 | $90,000 | $210,000 |
| 2014 | $3,315 | $233,000 | $69,900 | $163,100 |
Source: Public Records
Map
Nearby Homes
- 243 Chumalia St
- 225 Chumalia St
- 275 Haas Ave
- 523 Pala Ave
- 236 Haas Ave
- 845 Woodland Ave
- 483 Joaquin Ave
- 400 Davis St Unit 301
- 277 W Juana Ave
- 576 Begier Ave
- 1599 Hays St Unit 306
- 65 Thornton St
- 1400 Carpentier St
- 1400 Carpentier St Unit 315
- 1053 San Jose St
- 1550 Bancroft Ave Unit 112
- 1550 Bancroft Ave Unit 223
- 308 Elsie Ave
- 737 Cary Dr
- 532 Lafayette Ave
- 1135 Jefferson St Unit 5
- 1115 Jefferson St Unit 3
- 1101 Jefferson St Unit 1
- 1121 Jefferson St
- 259 Chumalia St
- 1108 Jefferson St
- 1132 Jefferson St
- 308 Chumalia St Unit 5
- 306 Chumalia St Unit 6
- 304 Chumalia St
- 1153 Jefferson St
- 1140 Jefferson St
- 282 Chumalia St
- 294 Chumalia St
- 296 Chumalia St
- 302 Chumalia St
- 264 Chumalia St
- 292 Chumalia St
- 294 Callan Ave
- 284 Callan Ave
Your Personal Tour Guide
Ask me questions while you tour the home.