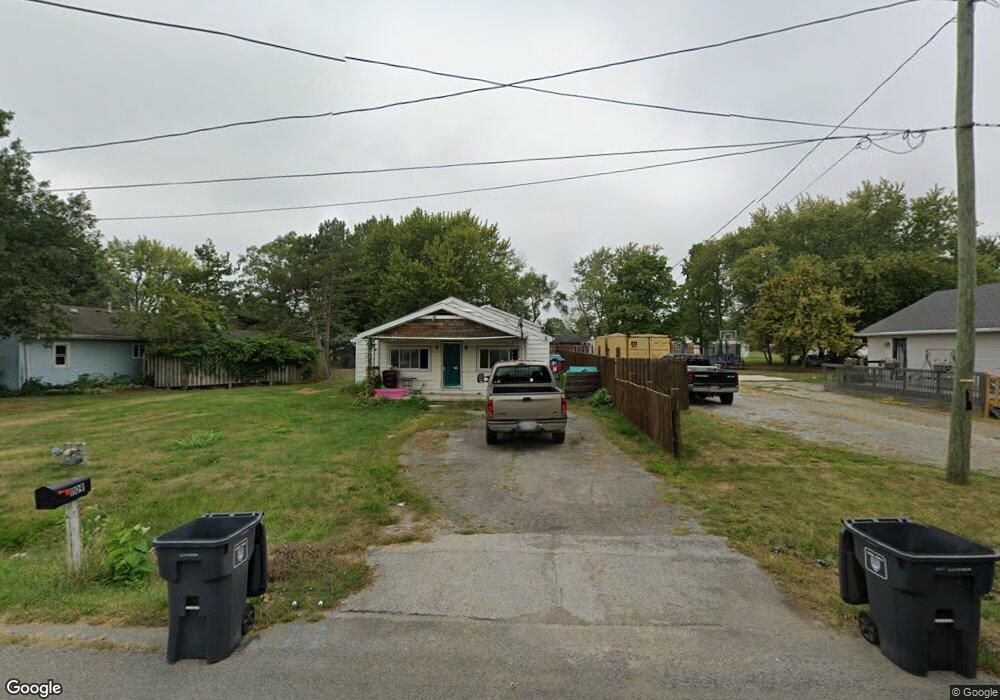
1109 Mccullough St Lima, OH 45801
Eastside Lima NeighborhoodEstimated Value: $57,000 - $99,445
4
Beds
2
Baths
1,568
Sq Ft
$53/Sq Ft
Est. Value
About This Home
This home is located at 1109 Mccullough St, Lima, OH 45801 and is currently estimated at $83,611, approximately $53 per square foot. 1109 Mccullough St is a home located in Allen County with nearby schools including Independence Elementary School, Lima North Middle School, and Lima West Middle School.
Ownership History
Date
Name
Owned For
Owner Type
Purchase Details
Closed on
Dec 4, 2024
Sold by
Adams Rodney F and Adams Jamie
Bought by
Bolender Charles A
Current Estimated Value
Purchase Details
Closed on
Feb 25, 2022
Sold by
Lepiota Rentals Ltd
Bought by
Adams Rodney F
Home Financials for this Owner
Home Financials are based on the most recent Mortgage that was taken out on this home.
Original Mortgage
$66,768
Interest Rate
3.55%
Mortgage Type
FHA
Purchase Details
Closed on
Sep 27, 2006
Sold by
Fannie Mae
Bought by
Lepiota Rentals Ltd
Purchase Details
Closed on
Jun 1, 1979
Bought by
Wagner Randall C
Create a Home Valuation Report for This Property
The Home Valuation Report is an in-depth analysis detailing your home's value as well as a comparison with similar homes in the area
Home Values in the Area
Average Home Value in this Area
Purchase History
| Date | Buyer | Sale Price | Title Company |
|---|---|---|---|
| Bolender Charles A | $22,500 | None Listed On Document | |
| Bolender Charles A | $22,500 | None Listed On Document | |
| Adams Rodney F | $68,000 | Daley Douglas A | |
| Adams Rodney F | $68,000 | Daley Douglas A | |
| Lepiota Rentals Ltd | $24,000 | None Available | |
| Wagner Randall C | $28,000 | -- |
Source: Public Records
Mortgage History
| Date | Status | Borrower | Loan Amount |
|---|---|---|---|
| Previous Owner | Adams Rodney F | $66,768 |
Source: Public Records
Tax History
| Year | Tax Paid | Tax Assessment Tax Assessment Total Assessment is a certain percentage of the fair market value that is determined by local assessors to be the total taxable value of land and additions on the property. | Land | Improvement |
|---|---|---|---|---|
| 2024 | $519 | $13,060 | $1,370 | $11,690 |
| 2023 | $569 | $12,430 | $1,300 | $11,130 |
| 2022 | $570 | $12,430 | $1,300 | $11,130 |
| 2021 | $599 | $12,430 | $1,300 | $11,130 |
| 2020 | $668 | $12,390 | $1,260 | $11,130 |
| 2019 | $668 | $12,390 | $1,260 | $11,130 |
| 2018 | $666 | $12,390 | $1,260 | $11,130 |
| 2017 | $681 | $12,390 | $1,260 | $11,130 |
| 2016 | $687 | $12,390 | $1,260 | $11,130 |
| 2015 | $804 | $12,390 | $1,260 | $11,130 |
| 2014 | $804 | $14,740 | $1,370 | $13,370 |
| 2013 | $786 | $14,740 | $1,370 | $13,370 |
Source: Public Records
Map
Nearby Homes
- 922 N Jefferson St
- 812 Christopher Dr
- 919 N Main St
- 1435 N Central Ave
- 1503 Findlay Rd Unit Lot 6
- 735 N Elizabeth St
- 316 Ewing Ave
- 1021 N McDonel St
- 514 & 516 N Elizabeth St
- 406 Ewing Ave
- 207 W Lane Ave
- 416 Hazel Ave
- 557 W Ashton Ave
- 576 W Ashton Ave
- 435 Marian Ave
- 934 N Metcalf St
- 608 W O'Connor Ave
- 635 W Ashton Ave
- 645 W O'Connor Ave
- 1212 Virginia Ave
- 1109 N Mccullough St
- 1101 Mccullough St
- 1114 Summit St
- 1112 Summit St
- 1116 Summit St
- 1100 Summit St
- 1104 Mccullough St
- 750 E Edwards St
- 1108 Mccullough St
- 1137 Mccullough St
- 1100 Mccullough St
- 1120 Summit St
- 1137 N Mccullough St
- 1110 Mccullough St
- 1021 Mccullough St
- 1120 N Summit St
- 1114 Mccullough St
- 1024 Mccullough St
Your Personal Tour Guide
Ask me questions while you tour the home.