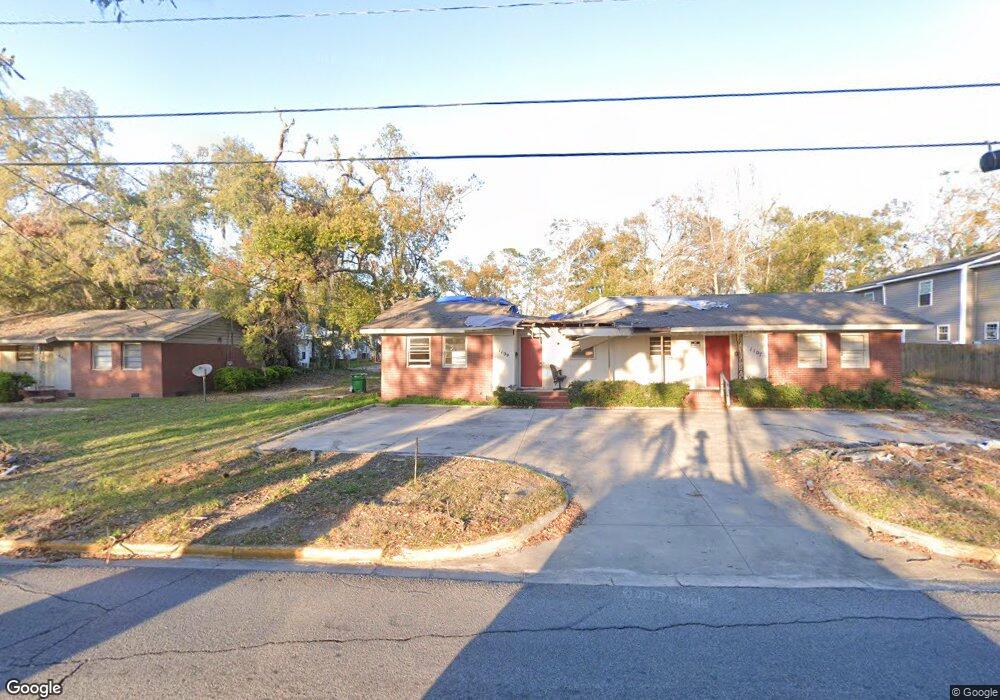
1109 N Oak St Unit 7-09 Valdosta, GA 31601
Estimated Value: $68,125 - $140,000
4
Beds
2
Baths
1,708
Sq Ft
$55/Sq Ft
Est. Value
About This Home
This home is located at 1109 N Oak St Unit 7-09, Valdosta, GA 31601 and is currently estimated at $94,031, approximately $55 per square foot. 1109 N Oak St Unit 7-09 is a home located in Lowndes County with nearby schools including S.L. Mason Elementary School, Valdosta Middle School, and Valdosta High School.
Ownership History
Date
Name
Owned For
Owner Type
Purchase Details
Closed on
May 28, 2025
Sold by
Lewis Tytyonna N
Bought by
Jj & T Management Llc
Current Estimated Value
Purchase Details
Closed on
Nov 8, 2024
Sold by
Jj & T Management Llc
Bought by
Lewis Tytyonna N
Purchase Details
Closed on
Oct 14, 2024
Sold by
Larsen Androckles Marius
Bought by
Jj & T Management Llc
Purchase Details
Closed on
Aug 15, 2016
Sold by
Barr Robert E and Barr Norma J
Bought by
Larsen Androckles Marius
Home Financials for this Owner
Home Financials are based on the most recent Mortgage that was taken out on this home.
Original Mortgage
$57,375
Interest Rate
3.42%
Mortgage Type
New Conventional
Purchase Details
Closed on
Feb 28, 1981
Bought by
Barr Robert Edward
Purchase Details
Closed on
Apr 27, 1979
Bought by
Hall Robert T
Create a Home Valuation Report for This Property
The Home Valuation Report is an in-depth analysis detailing your home's value as well as a comparison with similar homes in the area
Home Values in the Area
Average Home Value in this Area
Purchase History
| Date | Buyer | Sale Price | Title Company |
|---|---|---|---|
| Jj & T Management Llc | -- | -- | |
| Lewis Tytyonna N | $100 | -- | |
| Jj & T Management Llc | $65,000 | -- | |
| Larsen Androckles Marius | $67,500 | -- | |
| Barr Robert Edward | $17,400 | -- | |
| Hall Robert T | -- | -- | |
| Toal Desmond J | $32,000 | -- |
Source: Public Records
Mortgage History
| Date | Status | Borrower | Loan Amount |
|---|---|---|---|
| Previous Owner | Larsen Androckles Marius | $57,375 |
Source: Public Records
Tax History Compared to Growth
Tax History
| Year | Tax Paid | Tax Assessment Tax Assessment Total Assessment is a certain percentage of the fair market value that is determined by local assessors to be the total taxable value of land and additions on the property. | Land | Improvement |
|---|---|---|---|---|
| 2024 | $456 | $16,331 | $3,291 | $13,040 |
| 2023 | $456 | $46,759 | $3,291 | $43,468 |
| 2022 | $1,217 | $36,017 | $3,291 | $32,726 |
| 2021 | $1,252 | $36,017 | $3,291 | $32,726 |
| 2020 | $1,279 | $36,017 | $3,291 | $32,726 |
| 2019 | $1,442 | $40,619 | $3,291 | $37,328 |
| 2018 | $1,461 | $40,619 | $3,291 | $37,328 |
| 2017 | $978 | $40,619 | $3,291 | $37,328 |
| 2016 | $1,469 | $40,618 | $3,291 | $37,328 |
| 2015 | $1,348 | $40,618 | $3,291 | $37,328 |
| 2014 | $1,371 | $40,618 | $3,291 | $37,328 |
Source: Public Records
Map
Nearby Homes
- 1110 N Patterson St
- * Sustella - Green Unit 3
- 410 W Adair St
- 803 Johnson St
- 1402 Iola Dr
- 1208 N Ashley St
- 808 W Adair St
- 701 Johnson St
- 0 Canal St
- 704 3rd Ave
- 516 N Oak St
- 311 E Adair St
- 400 E Gordon St
- 820 W Gordon St
- 1412 N Lee St
- 1614 N Patterson St
- 300 Georgia Ave
- 724 J L Lomax Dr
- 1807 N Patterson St
- 311 Webster St
- 1109 N Oak St
- 1107 N Oak St
- 209 W Ann St
- 1113 N Oak St
- 207 W Ann St
- 1105 N Oak St
- 205 W Ann St
- 1108 N Toombs St
- 1106 N Toombs St
- 206 1/2 W Mary St
- 210 W Mary St
- 208 W Mary St
- 1201 N Oak St
- 208 W Ann St
- 208 W Ann St Unit A/B
- 206 W Ann St
- 1112 N Toombs St Unit B
- 1112 N Toombs St
- 206 W Mary St
- 204 W Ann St