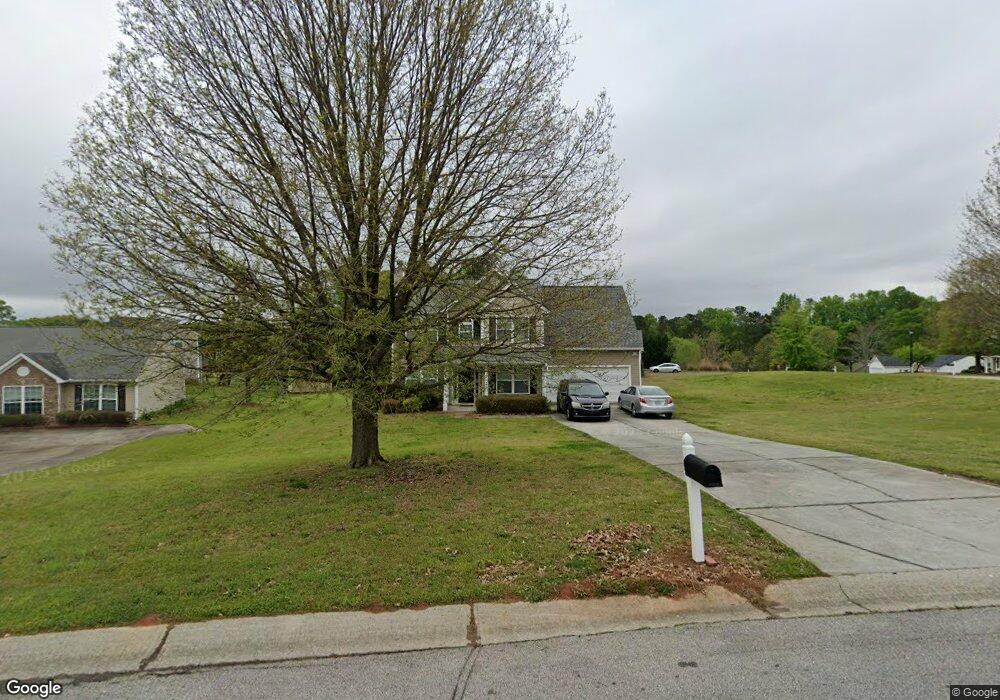
1109 Otis Dr Bethlehem, GA 30620
Estimated Value: $341,000 - $367,000
3
Beds
2
Baths
1,951
Sq Ft
$179/Sq Ft
Est. Value
About This Home
This home is located at 1109 Otis Dr, Bethlehem, GA 30620 and is currently estimated at $348,351, approximately $178 per square foot. 1109 Otis Dr is a home located in Barrow County with nearby schools including Yargo Elementary School, Haymon-Morris Middle School, and Apalachee High School.
Ownership History
Date
Name
Owned For
Owner Type
Purchase Details
Closed on
Jun 29, 2023
Sold by
Vuma Andre
Bought by
Tubajika Thierry
Current Estimated Value
Home Financials for this Owner
Home Financials are based on the most recent Mortgage that was taken out on this home.
Original Mortgage
$294,500
Interest Rate
6.79%
Mortgage Type
New Conventional
Purchase Details
Closed on
Oct 27, 2006
Sold by
Matungulu Nta Nancy
Bought by
Villamarzo Mario E
Purchase Details
Closed on
May 13, 2005
Sold by
Crown Pk Hms Of Cambridge Llc
Bought by
Matungulu Nta N
Home Financials for this Owner
Home Financials are based on the most recent Mortgage that was taken out on this home.
Original Mortgage
$160,400
Interest Rate
5.88%
Mortgage Type
New Conventional
Purchase Details
Closed on
Jun 29, 2004
Sold by
Millstone Development Group In
Bought by
Crown Park Homes At Cambridge Llc
Purchase Details
Closed on
Apr 1, 2004
Bought by
Millstone Development Group Inc
Create a Home Valuation Report for This Property
The Home Valuation Report is an in-depth analysis detailing your home's value as well as a comparison with similar homes in the area
Home Values in the Area
Average Home Value in this Area
Purchase History
| Date | Buyer | Sale Price | Title Company |
|---|---|---|---|
| Tubajika Thierry | $310,000 | -- | |
| Villamarzo Mario E | -- | -- | |
| Matungulu Nta N | $160,400 | -- | |
| Crown Park Homes At Cambridge Llc | $38,500 | -- | |
| Millstone Development Group Inc | -- | -- |
Source: Public Records
Mortgage History
| Date | Status | Borrower | Loan Amount |
|---|---|---|---|
| Previous Owner | Tubajika Thierry | $294,500 | |
| Previous Owner | Matungulu Nta N | $160,400 |
Source: Public Records
Tax History Compared to Growth
Tax History
| Year | Tax Paid | Tax Assessment Tax Assessment Total Assessment is a certain percentage of the fair market value that is determined by local assessors to be the total taxable value of land and additions on the property. | Land | Improvement |
|---|---|---|---|---|
| 2024 | $3,129 | $125,492 | $28,000 | $97,492 |
| 2023 | $3,437 | $118,670 | $28,000 | $90,670 |
| 2022 | $2,628 | $92,487 | $22,400 | $70,087 |
| 2021 | $2,301 | $76,713 | $18,000 | $58,713 |
| 2020 | $2,157 | $71,854 | $18,000 | $53,854 |
| 2019 | $2,193 | $71,854 | $18,000 | $53,854 |
| 2018 | $2,043 | $67,743 | $14,200 | $53,543 |
| 2017 | $1,667 | $57,249 | $14,200 | $43,049 |
| 2016 | $1,473 | $50,148 | $14,200 | $35,948 |
| 2015 | $1,491 | $50,539 | $14,200 | $36,339 |
| 2014 | $1,324 | $44,570 | $7,840 | $36,730 |
| 2013 | -- | $42,225 | $7,840 | $34,385 |
Source: Public Records
Map
Nearby Homes
- 1111 Otis Dr
- 1024 Lyndhurst Ln
- 209 Angie Way
- 1129 Loganville Hwy
- 303 Ron Dr
- 1164 Otis Dr
- 738 Worth Ct
- 720 Westbury Ct
- 724 Westbury Dr
- 704 Newnham Walk
- 713 Carl Bethlehem Rd
- 758 Clarence Edwards Rd
- 2018 Ben Johnson Rd
- 934 Beaver Hill Dr
- The Barnes Plan at River Meadows
- The Paisley Plan at River Meadows
- The Rose II Plan at River Meadows
- The Logan Plan at River Meadows
- 0 Jb Owens Unit 7552902
- 0 Jb Owens Unit 7552891
- 104 Skelton Cir
- 0 Skelton Cir Unit 7345096
- 0 Skelton Cir Unit 7015982
- 0 Skelton Cir Unit 8499274
- 0 Skelton Cir Unit 7556613
- 0 Skelton Cir Unit 7554651
- 205 Duxford Cir
- 205 Duxford Cir Unit 2
- 205 Duxford Cir Unit 113
- 1106 Otis Dr
- 105 Skelton Cir
- 0 Duxford Cir
- 108 Skelton Cir
- 1110 Otis Dr
- 103 Skelton Cir
- 1105 Otis Dr
- 107 Skelton Cir
- 204 Duxford Cir
- 200 Duxford Cir
- 0 Grafton Cir Unit 8198690