
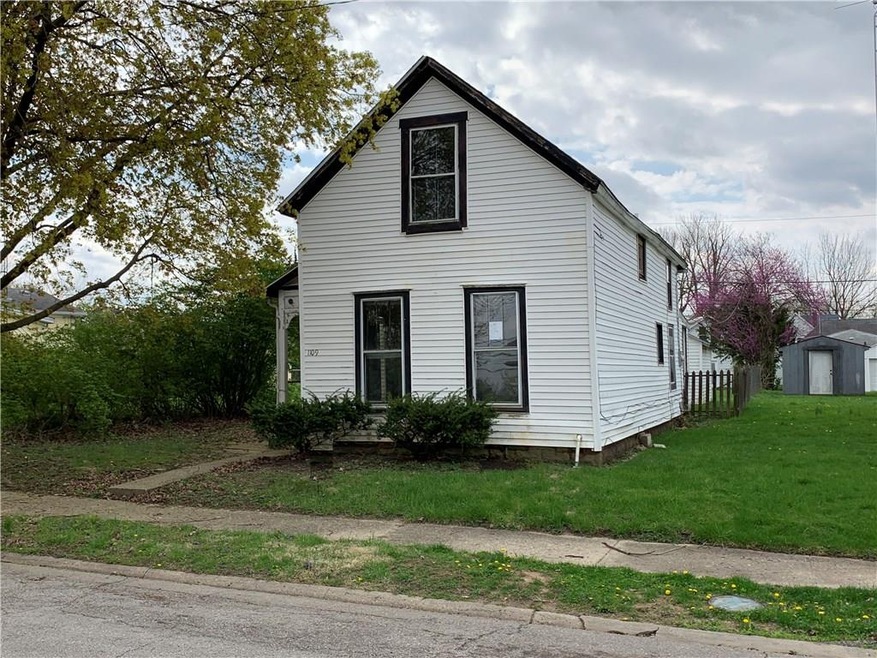
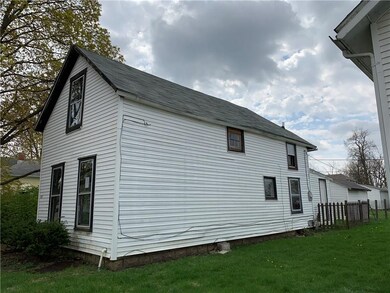
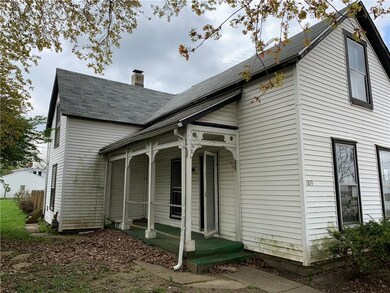
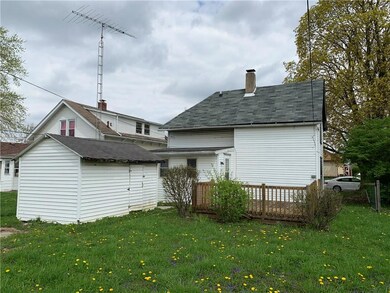
1109 Parry St Richmond, IN 47374
Estimated Value: $64,000 - $91,000
4
Beds
2
Baths
1,566
Sq Ft
$48/Sq Ft
Est. Value
Highlights
- Formal Dining Room
- Forced Air Heating System
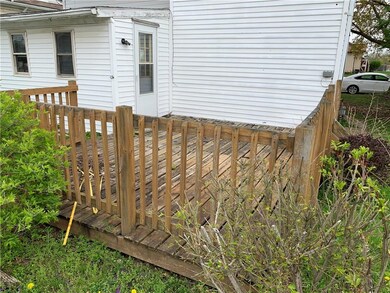
- Partially Fenced Property
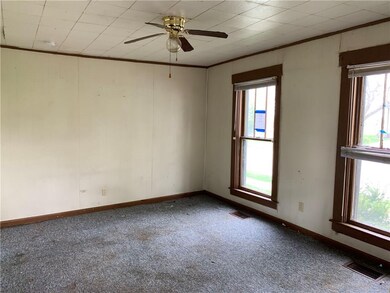
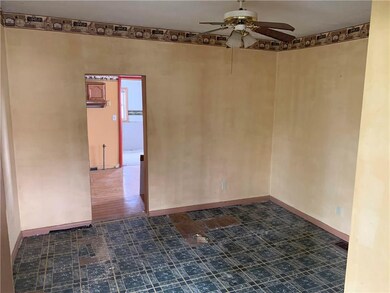
- Woodwork
About This Home
As of June 2019Single family home. Near amenities. 4 bedrooms, 1.5 baths. Immediate possession.
Last Agent to Sell the Property
Taflinger Real Estate Group License #RB14018444 Listed on: 04/23/2019
Last Buyer's Agent
Taflinger Real Estate Group License #RB14018444 Listed on: 04/23/2019
Home Details
Home Type
- Single Family
Year Built
- Built in 1920
Lot Details
- 4,800 Sq Ft Lot
- Partially Fenced Property
Home Design
- Stone Foundation
- Vinyl Siding
Interior Spaces
- 2-Story Property
- Woodwork
- Formal Dining Room
- Laundry on main level
Bedrooms and Bathrooms
- 4 Bedrooms
Unfinished Basement
- Partial Basement
- Sump Pump
- Crawl Space
Location
- Suburban Location
Utilities
- Forced Air Heating System
- Heating System Uses Gas
- Gas Water Heater
Community Details
- Greenwood Subdivision
Listing and Financial Details
- Assessor Parcel Number 891809110210000030
Ownership History
Date
Name
Owned For
Owner Type
Purchase Details
Listed on
Apr 23, 2019
Closed on
Jun 27, 2019
Sold by
2019 Castle Llc
Bought by
Sadatshirazi Arsalan
Seller's Agent
Brad Taflinger
Taflinger Real Estate Group
Buyer's Agent
Brad Taflinger
eXp Realty, LLC
List Price
$14,900
Sold Price
$10,850
Premium/Discount to List
-$4,050
-27.18%
Current Estimated Value
Home Financials for this Owner
Home Financials are based on the most recent Mortgage that was taken out on this home.
Estimated Appreciation
$64,251
Avg. Annual Appreciation
34.11%
Purchase Details
Closed on
Mar 13, 2019
Sold by
Us Bank Na
Bought by
2019 Castle Llc
Purchase Details
Closed on
Jul 22, 2015
Sold by
Sheriff Jeffrey F Cappa
Bought by
Us Bank National Association
Similar Homes in Richmond, IN
-
$80,000
- 4 Beds
- 2 Baths
- 806 S 8th St
- Richmond, IN
Add the finishing touch to this Multi-family home. Each Unit is a 2BR 1BA with first floor laundry. This project is ideal for investors or homeowners looking to customize the final details. New furnaces, New water heaters.
Elizabeth Hughey White's Realty
Create a Home Valuation Report for This Property
The Home Valuation Report is an in-depth analysis detailing your home's value as well as a comparison with similar homes in the area
Home Values in the Area
Average Home Value in this Area
Purchase History
| Date | Buyer | Sale Price | Title Company |
|---|---|---|---|
| Sadatshirazi Arsalan | -- | -- | |
| 2019 Castle Llc | -- | -- | |
| Us Bank National Association | $23,100 | -- |
Source: Public Records
Property History
| Date | Event | Price | Change | Sq Ft Price |
|---|---|---|---|---|
| 06/28/2019 06/28/19 | Sold | $10,850 | -8.8% | $7 / Sq Ft |
| 06/13/2019 06/13/19 | Pending | -- | -- | -- |
| 05/21/2019 05/21/19 | Price Changed | $11,900 | -20.1% | $8 / Sq Ft |
| 04/23/2019 04/23/19 | For Sale | $14,900 | -- | $10 / Sq Ft |
Source: MIBOR Broker Listing Cooperative®
Tax History Compared to Growth
Tax History
| Year | Tax Paid | Tax Assessment Tax Assessment Total Assessment is a certain percentage of the fair market value that is determined by local assessors to be the total taxable value of land and additions on the property. | Land | Improvement |
|---|---|---|---|---|
| 2024 | $380 | $19,000 | $5,000 | $14,000 |
| 2023 | $380 | $19,000 | $5,000 | $14,000 |
| 2022 | $380 | $19,000 | $5,000 | $14,000 |
| 2021 | $380 | $19,000 | $5,000 | $14,000 |
| 2020 | $380 | $33,500 | $5,000 | $28,500 |
| 2019 | $670 | $33,500 | $5,000 | $28,500 |
| 2018 | $700 | $34,500 | $5,000 | $29,500 |
| 2017 | $712 | $35,100 | $5,000 | $30,100 |
| 2016 | $717 | $35,300 | $5,000 | $30,300 |
| 2014 | $904 | $45,200 | $5,000 | $40,200 |
| 2013 | $904 | $43,800 | $5,000 | $38,800 |
Source: Public Records
Agents Affiliated with this Home
-
Brad Taflinger
Seller's Agent in 2019
Brad Taflinger
Taflinger Real Estate Group
(765) 748-2104
391 Total Sales
Map
Source: MIBOR Broker Listing Cooperative®
MLS Number: MBR21635892
APN: 89-18-09-110-210.000-030
Disclaimer: Certain information contained herein is derived from information provided by parties other than Homes.com. All information provided is deemed reliable, but is not guaranteed to be accurate and should be independently verified.
![]() Based on information submitted to the MLS GRID. All data is obtained from various sources and may not have been verified by broker or MLS GRID. Supplied Open House Information is subject to change without notice. All information should be independently reviewed and verified for accuracy. Properties may or may not be listed by the office/agent presenting the information. Some IDX listings have been excluded from this website.
Based on information submitted to the MLS GRID. All data is obtained from various sources and may not have been verified by broker or MLS GRID. Supplied Open House Information is subject to change without notice. All information should be independently reviewed and verified for accuracy. Properties may or may not be listed by the office/agent presenting the information. Some IDX listings have been excluded from this website.
Nearby Homes