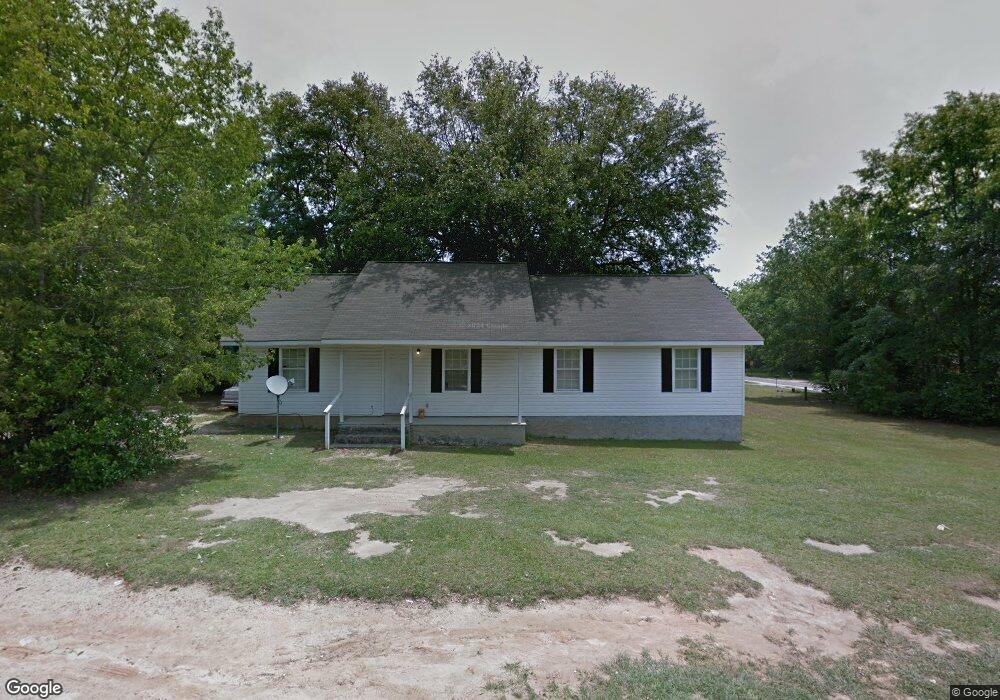
1109 S 15th St Cordele, GA 31015
Estimated Value: $67,000 - $151,652
3
Beds
2
Baths
1,540
Sq Ft
$72/Sq Ft
Est. Value
About This Home
This home is located at 1109 S 15th St, Cordele, GA 31015 and is currently estimated at $110,163, approximately $71 per square foot. 1109 S 15th St is a home with nearby schools including Crisp County Elementary School, Crisp County Primary School, and Crisp County Middle School.
Ownership History
Date
Name
Owned For
Owner Type
Purchase Details
Closed on
Aug 6, 2013
Sold by
United States Of America
Bought by
United States Of America
Current Estimated Value
Purchase Details
Closed on
Mar 5, 2002
Sold by
Summa Builders
Bought by
Curry Yolanda L
Purchase Details
Closed on
Sep 14, 2001
Sold by
Zellars Nathan
Bought by
Summa Builders
Purchase Details
Closed on
May 8, 2000
Sold by
Zellars Eric
Bought by
Zellars Nathan
Purchase Details
Closed on
Jul 6, 1961
Sold by
Wright Joe
Bought by
Grace Bernice
Purchase Details
Closed on
Jan 31, 1956
Bought by
Wright Joe
Create a Home Valuation Report for This Property
The Home Valuation Report is an in-depth analysis detailing your home's value as well as a comparison with similar homes in the area
Home Values in the Area
Average Home Value in this Area
Purchase History
| Date | Buyer | Sale Price | Title Company |
|---|---|---|---|
| United States Of America | $32,206 | -- | |
| Curry Yolanda L | $72,000 | -- | |
| Summa Builders | $9,500 | -- | |
| Zellars Nathan | -- | -- | |
| Grace Bernice | -- | -- | |
| Wright Joe | -- | -- |
Source: Public Records
Tax History Compared to Growth
Tax History
| Year | Tax Paid | Tax Assessment Tax Assessment Total Assessment is a certain percentage of the fair market value that is determined by local assessors to be the total taxable value of land and additions on the property. | Land | Improvement |
|---|---|---|---|---|
| 2024 | $1,619 | $45,183 | $2,000 | $43,183 |
| 2023 | $1,596 | $42,565 | $2,000 | $40,565 |
| 2022 | $1,056 | $39,947 | $2,000 | $37,947 |
| 2021 | $1,035 | $37,329 | $2,000 | $35,329 |
| 2020 | $1,051 | $37,329 | $2,000 | $35,329 |
| 2019 | $1,059 | $37,329 | $2,000 | $35,329 |
| 2018 | $1,144 | $38,816 | $3,000 | $35,816 |
| 2017 | $1,576 | $38,816 | $3,000 | $35,816 |
| 2016 | $1,148 | $38,816 | $3,000 | $35,816 |
| 2015 | -- | $38,816 | $3,000 | $35,816 |
| 2014 | -- | $38,816 | $3,000 | $35,816 |
| 2013 | -- | $38,816 | $3,000 | $35,816 |
Source: Public Records
Map
Nearby Homes