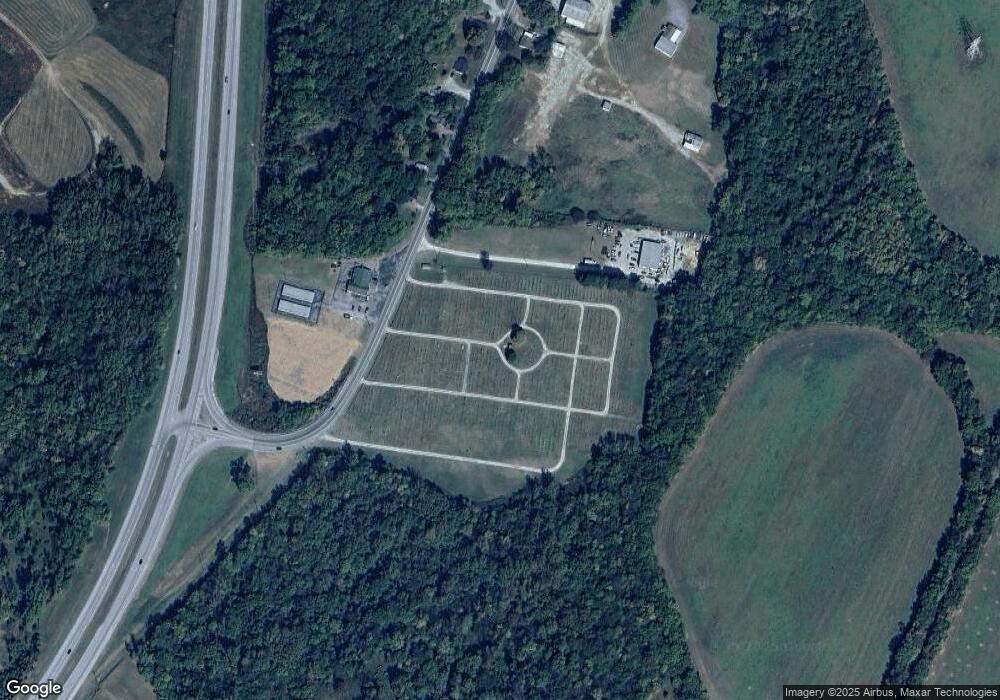
1109 S Main St Mount Pleasant, TN 38474
Estimated Value: $582,953
--
Bed
--
Bath
4,800
Sq Ft
$121/Sq Ft
Est. Value
About This Home
This home is located at 1109 S Main St, Mount Pleasant, TN 38474 and is currently estimated at $582,953, approximately $121 per square foot. 1109 S Main St is a home located in Maury County with nearby schools including J.E. Woody Elementary School, Mt. Pleasant Middle School of the Visual & Performing Arts, and Mt. Pleasant High School.
Ownership History
Date
Name
Owned For
Owner Type
Purchase Details
Closed on
Apr 30, 2024
Sold by
Ford Julia and Papineau Michael A
Bought by
Tennessee Aluminum Processors Inc
Current Estimated Value
Purchase Details
Closed on
Oct 17, 2019
Sold by
Holt Joe G and Holt John Robin
Bought by
Papineau Michael A and Papineau Julia
Home Financials for this Owner
Home Financials are based on the most recent Mortgage that was taken out on this home.
Original Mortgage
$145,000
Interest Rate
3.4%
Mortgage Type
Commercial
Purchase Details
Closed on
May 11, 1993
Bought by
Holt Joe G
Purchase Details
Closed on
Apr 22, 1986
Bought by
Knox Tillman Trustee
Create a Home Valuation Report for This Property
The Home Valuation Report is an in-depth analysis detailing your home's value as well as a comparison with similar homes in the area
Home Values in the Area
Average Home Value in this Area
Purchase History
| Date | Buyer | Sale Price | Title Company |
|---|---|---|---|
| Tennessee Aluminum Processors Inc | $575,000 | None Listed On Document | |
| Tennessee Aluminum Processors Inc | $575,000 | None Listed On Document | |
| Papineau Michael A | $175,000 | Foundation T&E Series Llc Co | |
| Holt Joe G | $10,000 | -- | |
| Knox Tillman Trustee | -- | -- |
Source: Public Records
Mortgage History
| Date | Status | Borrower | Loan Amount |
|---|---|---|---|
| Previous Owner | Papineau Michael A | $145,000 |
Source: Public Records
Tax History Compared to Growth
Tax History
| Year | Tax Paid | Tax Assessment Tax Assessment Total Assessment is a certain percentage of the fair market value that is determined by local assessors to be the total taxable value of land and additions on the property. | Land | Improvement |
|---|---|---|---|---|
| 2024 | $1,522 | $79,680 | $36,200 | $43,480 |
| 2023 | -- | $79,680 | $36,200 | $43,480 |
| 2022 | $2,869 | $79,680 | $36,200 | $43,480 |
| 2021 | $2,869 | $36,600 | $24,120 | $12,480 |
| 2020 | $1,427 | $36,600 | $24,120 | $12,480 |
| 2019 | $1,186 | $36,600 | $24,120 | $12,480 |
| 2018 | $1,186 | $36,600 | $24,120 | $12,480 |
| 2017 | $1,172 | $26,440 | $16,160 | $10,280 |
| 2016 | $1,173 | $26,440 | $16,160 | $10,280 |
| 2015 | $1,121 | $26,440 | $16,160 | $10,280 |
| 2014 | $1,121 | $26,440 | $16,160 | $10,280 |
Source: Public Records
Map
Nearby Homes
- 1 Mount Joy Rd
- 2 Mount Joy Rd
- 7919 Golf Club Rd
- 8025 Dry Creek Rd
- 3 Enterprise Rd
- 4 Enterprise Rd
- 1 Enterprise Rd
- 708 Gray St
- 115 Union St
- 108 Mcafee Dr
- 12 Joy Rd
- 214 Boswell St
- 212 Boswell St
- 209 Olive St
- 118 Jordan Ave
- 106 Jordan Ave
- 205 Bellview Dr
- 204 S Cherry St
- 309 Washington Ave
- 208 Hay Long Ave
