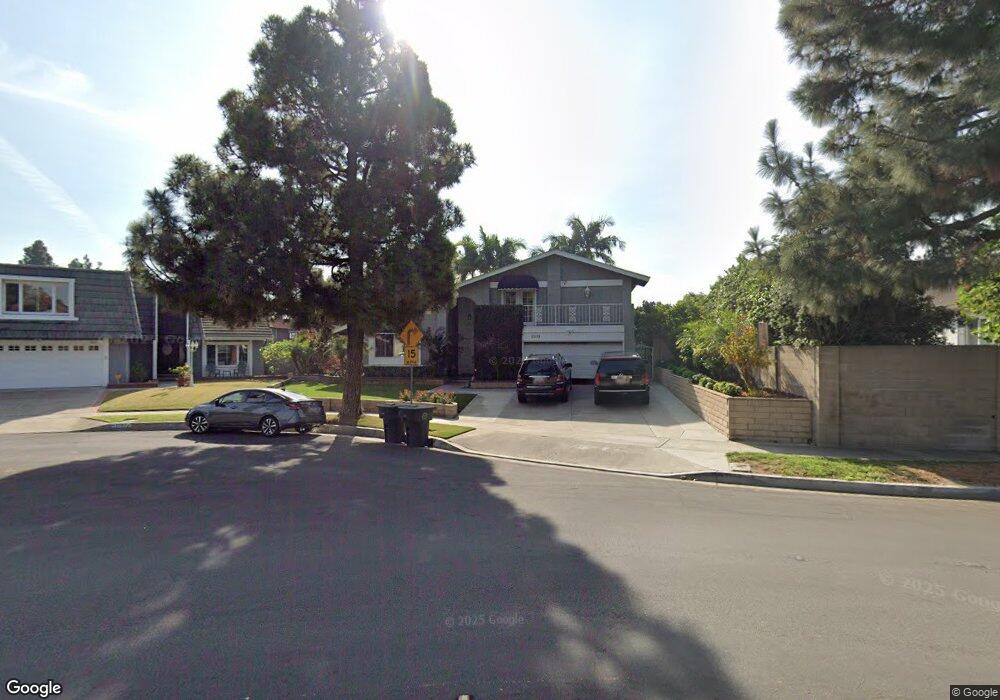
1109 Salinas Ave Costa Mesa, CA 92626
Northside Costa Mesa NeighborhoodEstimated Value: $1,608,000 - $1,810,000
4
Beds
3
Baths
2,418
Sq Ft
$697/Sq Ft
Est. Value
About This Home
This home is located at 1109 Salinas Ave, Costa Mesa, CA 92626 and is currently estimated at $1,686,411, approximately $697 per square foot. 1109 Salinas Ave is a home located in Orange County with nearby schools including Paularino Elementary School, Costa Mesa High School, and California Pacific Charter - San Diego.
Ownership History
Date
Name
Owned For
Owner Type
Purchase Details
Closed on
May 5, 2008
Sold by
Washington Mutual Bank Fa
Bought by
Tran Huy Quoc and Chu Kim Nga
Current Estimated Value
Home Financials for this Owner
Home Financials are based on the most recent Mortgage that was taken out on this home.
Original Mortgage
$417,000
Outstanding Balance
$264,084
Interest Rate
5.88%
Mortgage Type
Purchase Money Mortgage
Estimated Equity
$1,422,327
Purchase Details
Closed on
Jan 4, 2008
Sold by
Jaure Deborah
Bought by
Washington Mutual Bank Fa
Purchase Details
Closed on
Nov 21, 2005
Sold by
Balderrama Bruno and Balderrama Maria
Bought by
Jaure Deborah
Home Financials for this Owner
Home Financials are based on the most recent Mortgage that was taken out on this home.
Original Mortgage
$640,000
Interest Rate
8%
Mortgage Type
Fannie Mae Freddie Mac
Create a Home Valuation Report for This Property
The Home Valuation Report is an in-depth analysis detailing your home's value as well as a comparison with similar homes in the area
Home Values in the Area
Average Home Value in this Area
Purchase History
| Date | Buyer | Sale Price | Title Company |
|---|---|---|---|
| Tran Huy Quoc | $665,000 | Chicago Title Company | |
| Washington Mutual Bank Fa | $702,000 | None Available | |
| Jaure Deborah | $800,000 | Fidelity National Title |
Source: Public Records
Mortgage History
| Date | Status | Borrower | Loan Amount |
|---|---|---|---|
| Open | Tran Huy Quoc | $417,000 | |
| Previous Owner | Jaure Deborah | $640,000 |
Source: Public Records
Tax History Compared to Growth
Tax History
| Year | Tax Paid | Tax Assessment Tax Assessment Total Assessment is a certain percentage of the fair market value that is determined by local assessors to be the total taxable value of land and additions on the property. | Land | Improvement |
|---|---|---|---|---|
| 2025 | $10,022 | $873,483 | $671,120 | $202,363 |
| 2024 | $10,022 | $856,356 | $657,960 | $198,396 |
| 2023 | $9,719 | $839,565 | $645,059 | $194,506 |
| 2022 | $9,448 | $823,103 | $632,410 | $190,693 |
| 2021 | $9,203 | $806,964 | $620,010 | $186,954 |
| 2020 | $9,101 | $798,690 | $613,652 | $185,038 |
| 2019 | $8,908 | $783,030 | $601,620 | $181,410 |
| 2018 | $8,730 | $767,677 | $589,824 | $177,853 |
| 2017 | $8,582 | $752,625 | $578,259 | $174,366 |
| 2016 | $8,397 | $737,868 | $566,920 | $170,948 |
| 2015 | $8,317 | $726,785 | $558,404 | $168,381 |
| 2014 | $8,127 | $712,549 | $547,466 | $165,083 |
Source: Public Records
Map
Nearby Homes
- 3424 Summerset Cir
- 3375 Fuchsia St
- 1174 Kingston St
- 3493 San Marino Cir
- 2511 W Sunflower Ave Unit K4
- 2511 W Sunflower Ave Unit P6
- 2511 W Sunflower Ave Unit P4
- 2738 W Keller Ave
- 2521 W Sunflower Ave Unit R1
- 2521 W Sunflower Ave Unit H2
- 2521 W Sunflower Ave Unit R8
- 2521 W Sunflower Ave Unit D4
- 2619 W Aurora St
- 973 Azalea Dr
- 2732 W Orion Ave
- 3626 S Marine St
- 2542 W Macarthur Blvd Unit 134
- 2619 W Orion Ave
- 3050 Madison Ave
- 3040 Fillmore Way
- 1102 Redding Ave
- 1107 Salinas Ave
- 1108 Tulare Dr
- 1106 Tulare Dr
- 1104 Tulare Dr
- 1105 Salinas Ave
- 1098 Redding Ave
- 1106 Redding Ave
- 1103 Salinas Ave
- 1110 Salinas Ave
- 1102 Tulare Dr
- 1114 Salinas Ave
- 3255 Turlock Dr
- 3253 Turlock Dr
- 3257 Turlock Dr
- 1101 Salinas Ave
- 1110 Redding Ave
- 3251 Turlock Dr
- 1118 Salinas Ave
- 1100 Tulare Dr