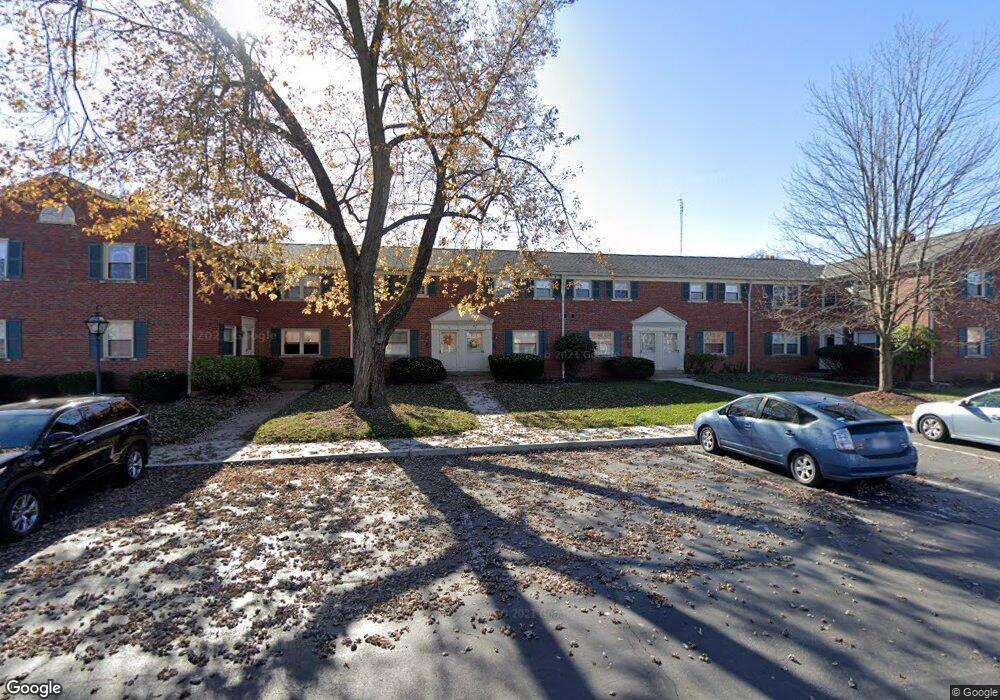
1109 Sells Ave Unit 26 Columbus, OH 43212
Tri-Village NeighborhoodEstimated Value: $124,000 - $140,000
1
Bed
1
Bath
606
Sq Ft
$219/Sq Ft
Est. Value
About This Home
This home is located at 1109 Sells Ave Unit 26, Columbus, OH 43212 and is currently estimated at $132,549, approximately $218 per square foot. 1109 Sells Ave Unit 26 is a home located in Franklin County with nearby schools including Cranbrook Elementary School, Ridgeview Middle School, and Centennial High School.
Ownership History
Date
Name
Owned For
Owner Type
Purchase Details
Closed on
Mar 19, 2021
Sold by
Benson Fred S
Bought by
Beres Nicholas J
Current Estimated Value
Home Financials for this Owner
Home Financials are based on the most recent Mortgage that was taken out on this home.
Original Mortgage
$70,000
Outstanding Balance
$52,007
Interest Rate
3.5%
Mortgage Type
New Conventional
Estimated Equity
$80,542
Purchase Details
Closed on
Mar 11, 2021
Sold by
Benson Fred S
Bought by
Beres Nicholas J
Home Financials for this Owner
Home Financials are based on the most recent Mortgage that was taken out on this home.
Original Mortgage
$70,000
Outstanding Balance
$52,007
Interest Rate
3.5%
Mortgage Type
New Conventional
Estimated Equity
$80,542
Purchase Details
Closed on
Aug 28, 2009
Sold by
Benson Steve and Benson Melissa
Bought by
Benson Fred S
Purchase Details
Closed on
Sep 29, 2006
Sold by
Somerset Partners Llc
Bought by
Benson Steven and Benson Melissa
Home Financials for this Owner
Home Financials are based on the most recent Mortgage that was taken out on this home.
Original Mortgage
$47,920
Interest Rate
6.49%
Mortgage Type
Purchase Money Mortgage
Purchase Details
Closed on
Mar 17, 1981
Bought by
Klingbeil Group Inc
Create a Home Valuation Report for This Property
The Home Valuation Report is an in-depth analysis detailing your home's value as well as a comparison with similar homes in the area
Home Values in the Area
Average Home Value in this Area
Purchase History
| Date | Buyer | Sale Price | Title Company |
|---|---|---|---|
| Beres Nicholas J | $87,500 | None Listed On Document | |
| Beres Nicholas J | $87,500 | None Available | |
| Benson Fred S | $48,400 | Hostetler | |
| Benson Steven | $59,900 | Title First | |
| Klingbeil Group Inc | -- | -- |
Source: Public Records
Mortgage History
| Date | Status | Borrower | Loan Amount |
|---|---|---|---|
| Open | Beres Nicholas J | $70,000 | |
| Closed | Beres Nicholas J | $70,000 | |
| Previous Owner | Benson Steven | $47,920 |
Source: Public Records
Tax History Compared to Growth
Tax History
| Year | Tax Paid | Tax Assessment Tax Assessment Total Assessment is a certain percentage of the fair market value that is determined by local assessors to be the total taxable value of land and additions on the property. | Land | Improvement |
|---|---|---|---|---|
| 2024 | $1,598 | $35,600 | $12,250 | $23,350 |
| 2023 | $1,577 | $35,595 | $12,250 | $23,345 |
| 2022 | $1,817 | $35,040 | $10,710 | $24,330 |
| 2021 | $1,865 | $35,040 | $10,710 | $24,330 |
| 2020 | $1,868 | $35,040 | $10,710 | $24,330 |
| 2019 | $1,676 | $26,960 | $8,230 | $18,730 |
| 2018 | $1,540 | $26,960 | $8,230 | $18,730 |
| 2017 | $1,676 | $26,960 | $8,230 | $18,730 |
| 2016 | $1,546 | $22,750 | $3,850 | $18,900 |
| 2015 | $1,407 | $22,750 | $3,850 | $18,900 |
| 2014 | $1,411 | $22,750 | $3,850 | $18,900 |
| 2013 | $696 | $22,750 | $3,850 | $18,900 |
Source: Public Records
Map
Nearby Homes
- 1126 King Ave Unit 128
- 00 W 7th Ave
- 1364 W 7th Ave
- 1398 Lower Green Cir Unit 1398
- 1846 Rhoda Ave
- 1914 Elmwood Ave
- 1661 Ashland Ave Unit 663
- 1297 Doten Ave
- 1733 Elmwood Ave
- 1095 W 3rd Ave
- 1093 W 3rd Ave
- 1242 Oxley Rd
- 1083 W 3rd Ave
- 1240 Oxley Rd
- 1475 W 3rd Ave Unit 204
- 1225 Eastview Ave
- 1535 Doone Rd
- 1782 Wyandotte Rd
- 2110 Northwest Blvd
- 1459 Elmwood Ave Unit 1459
- 1109 Sells Ave Unit 36
- 1109 Sells Ave Unit 28
- 1109 Sells Ave Unit 35
- 1109 Sells Ave Unit 31
- 1109 Sells Ave Unit 25
- 1109 Sells Ave Unit 30
- 1109 Sells Ave Unit 34
- 1109 Sells Ave Unit 29
- 1109 Sells Ave Unit 32
- 1109 Sells Ave
- 1109 Sells Ave Unit 33
- 1109 Sells Ave Unit F
- 1109 Sells Ave Unit E
- 1109 Sells Ave Unit L
- 1109 Sells Ave Unit I
- 1109 Sells Ave Unit B
- 1109 Sells Ave Unit H
- 1109 Sells Ave Unit K
- 1109 Sells Ave Unit G
- 1109 Sells Ave Unit D