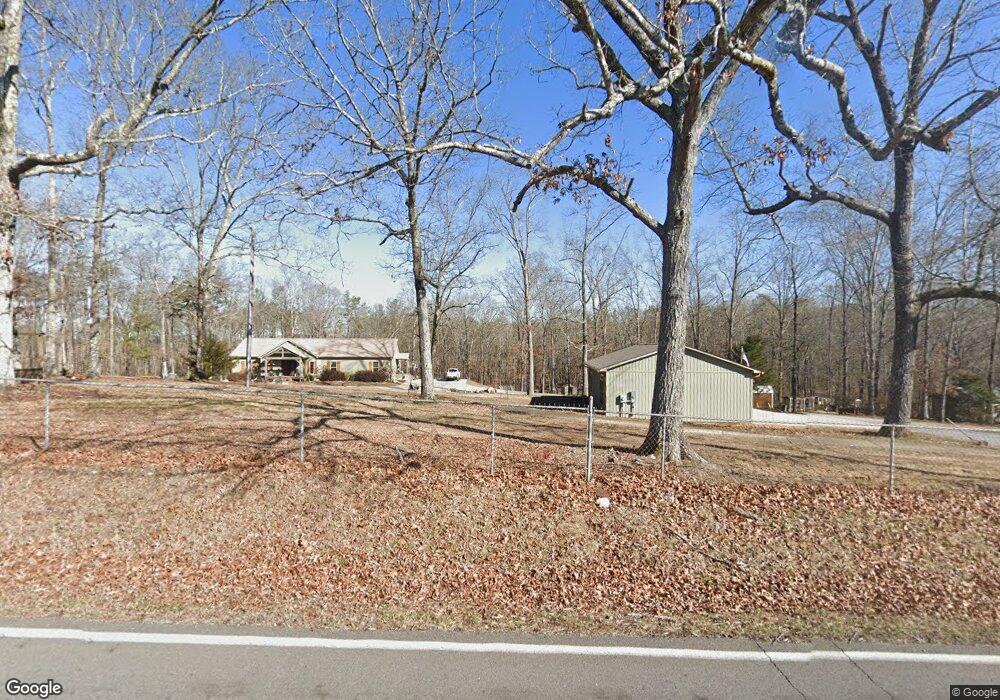
1109 Taylorsville Rd Aragon, GA 30104
Estimated Value: $570,000 - $772,000
--
Bed
--
Bath
2,434
Sq Ft
$273/Sq Ft
Est. Value
About This Home
This home is located at 1109 Taylorsville Rd, Aragon, GA 30104 and is currently estimated at $664,271, approximately $272 per square foot. 1109 Taylorsville Rd is a home with nearby schools including Pepperell Middle School and Pepperell High School.
Ownership History
Date
Name
Owned For
Owner Type
Purchase Details
Closed on
Nov 17, 2017
Sold by
Worthington Stephen F
Bought by
Braden Hunter Lawson and Braden Jennifer Lee
Current Estimated Value
Home Financials for this Owner
Home Financials are based on the most recent Mortgage that was taken out on this home.
Original Mortgage
$280,000
Outstanding Balance
$238,001
Interest Rate
4%
Mortgage Type
New Conventional
Estimated Equity
$426,270
Purchase Details
Closed on
Apr 2, 2015
Sold by
Gentry Andy Arnold
Bought by
Worthington Stephen F and Worthington Amy D
Purchase Details
Closed on
Feb 5, 2015
Sold by
Gentry Barbara Jean
Bought by
Gentry Andy Arnold
Purchase Details
Closed on
Oct 2, 2014
Sold by
Gentry Barbara
Bought by
Gentry Andy Arnold
Purchase Details
Closed on
Dec 14, 2007
Sold by
Not Provided
Bought by
Gentry Barbara A
Purchase Details
Closed on
Oct 12, 1968
Bought by
Gentry Barbara Jean
Create a Home Valuation Report for This Property
The Home Valuation Report is an in-depth analysis detailing your home's value as well as a comparison with similar homes in the area
Home Values in the Area
Average Home Value in this Area
Purchase History
| Date | Buyer | Sale Price | Title Company |
|---|---|---|---|
| Braden Hunter Lawson | $36,000 | -- | |
| Worthington Stephen F | $105,000 | -- | |
| Gentry Andy Arnold | -- | -- | |
| Gentry Andy Arnold | -- | -- | |
| Gentry Barbara A | -- | -- | |
| Gentry Barbara Jean | -- | -- |
Source: Public Records
Mortgage History
| Date | Status | Borrower | Loan Amount |
|---|---|---|---|
| Open | Braden Hunter Lawson | $280,000 |
Source: Public Records
Tax History Compared to Growth
Tax History
| Year | Tax Paid | Tax Assessment Tax Assessment Total Assessment is a certain percentage of the fair market value that is determined by local assessors to be the total taxable value of land and additions on the property. | Land | Improvement |
|---|---|---|---|---|
| 2024 | $6,189 | $270,845 | $16,210 | $254,635 |
| 2023 | $6,224 | $234,461 | $14,736 | $219,725 |
| 2022 | $4,763 | $175,379 | $12,157 | $163,222 |
| 2021 | $4,306 | $145,854 | $11,064 | $134,790 |
| 2020 | $3,743 | $122,976 | $9,621 | $113,355 |
| 2019 | $3,539 | $117,830 | $9,621 | $108,209 |
| 2018 | $226 | $7,510 | $4,478 | $3,032 |
| 2017 | $291 | $9,662 | $6,630 | $3,032 |
| 2016 | $294 | $9,632 | $6,600 | $3,032 |
| 2015 | -- | $9,620 | $6,600 | $3,020 |
| 2014 | -- | $9,632 | $6,600 | $3,032 |
Source: Public Records
Map
Nearby Homes
- 320 Brumbelow Rd
- 2011 Bailey Rd SE
- 2557 Wax Rd SE
- 00 John Kay Rd
- 1337 Abrams Rd SE
- 52 Lloyd Dr SE
- 1424 Harmony Rd SE
- 167 Iron Hill Rd
- 77 Popham Rd
- 169 Williams Rd
- 0 John Kay Rd Unit 10497667
- 0 John Kay Rd Unit 22982738
- 0 John Kay Rd Unit 10451223
- 0 John Kay Rd Unit 10451216
- 0 John Kay Rd Unit 22961830
- 0 John Kay Rd Unit 7517782
- 0 John Kay Rd Unit 22961024
- 110 Williams Rd SE
- 838 Pleasant Hope Rd SE
- 129 Miller Farm Rd
- 1104 Old Taylorsville Rd
- 1125 Taylorsville Rd
- 1077 Taylorsville Rd
- 1146 Taylorsville Rd
- 990 Aragon Taylorsville Rd
- 1654 Bailey Rd SE
- 1986 Bailey Rd SE
- 980 Taylorsville Rd
- 1956 Bailey Rd SE
- 1984 Bailey Rd SE
- 1285 Taylorsville Rd
- 50 Brumbelow Rd
- 1926 Bailey Rd SE
- 1282 Taylorsville Rd
- 2064 Bailey Rd SE
- 2003 Bailey Rd SE
- 1645 Morris Rd
- 1941 Bailey Rd SE
- 1941 Bailey Rd SE
- 1292 Taylorsville Rd