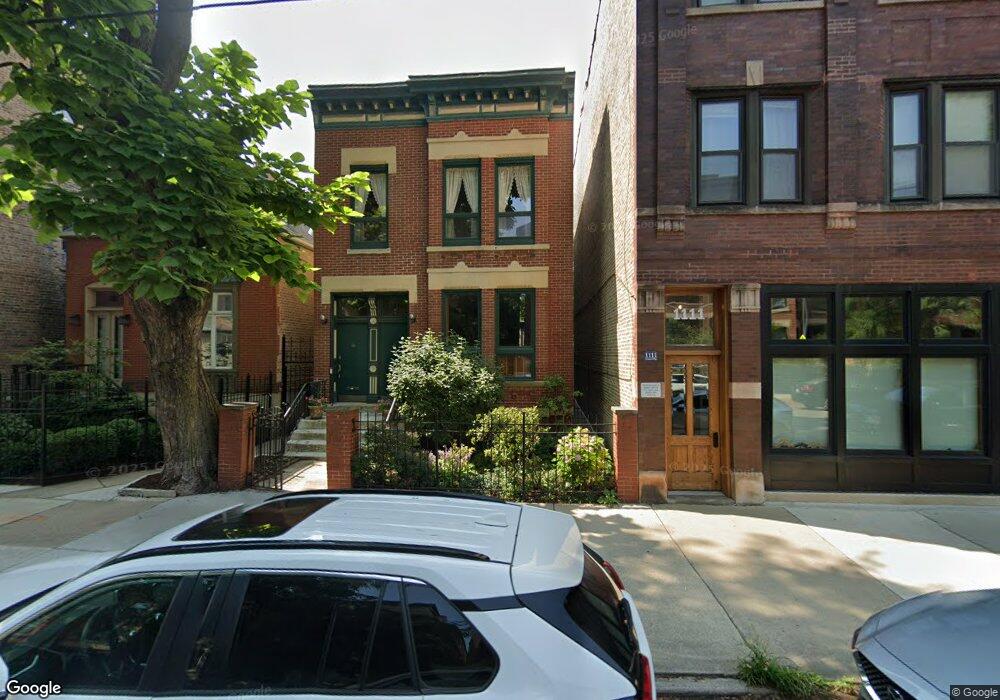
1109 W Webster Ave Unit 1 Chicago, IL 60614
Old Town NeighborhoodEstimated Value: $648,000 - $797,000
--
Bed
--
Bath
4,626
Sq Ft
$159/Sq Ft
Est. Value
About This Home
This home is located at 1109 W Webster Ave Unit 1, Chicago, IL 60614 and is currently estimated at $733,229, approximately $158 per square foot. 1109 W Webster Ave Unit 1 is a home located in Cook County with nearby schools including Mayer Elementary School, Lincoln Park High School, and St Josaphat School.
Ownership History
Date
Name
Owned For
Owner Type
Purchase Details
Closed on
Apr 2, 1997
Sold by
Lentz Walter A
Bought by
Glaze Robert H and Robert H Glaze Revocable Trust
Current Estimated Value
Home Financials for this Owner
Home Financials are based on the most recent Mortgage that was taken out on this home.
Original Mortgage
$175,000
Outstanding Balance
$22,349
Interest Rate
7.75%
Estimated Equity
$710,880
Purchase Details
Closed on
Oct 25, 1995
Sold by
Blackman Gary I and Blackman Patricia R
Bought by
Lentz Walter A
Home Financials for this Owner
Home Financials are based on the most recent Mortgage that was taken out on this home.
Original Mortgage
$260,000
Interest Rate
7.12%
Purchase Details
Closed on
Jan 25, 1995
Sold by
Blackman Gary I and Blackman Patricia R
Bought by
Blackman Gary I and Blackman Patricia R
Create a Home Valuation Report for This Property
The Home Valuation Report is an in-depth analysis detailing your home's value as well as a comparison with similar homes in the area
Home Values in the Area
Average Home Value in this Area
Purchase History
| Date | Buyer | Sale Price | Title Company |
|---|---|---|---|
| Glaze Robert H | $367,500 | -- | |
| Lentz Walter A | $325,000 | -- | |
| Blackman Gary I | -- | -- |
Source: Public Records
Mortgage History
| Date | Status | Borrower | Loan Amount |
|---|---|---|---|
| Open | Glaze Robert H | $175,000 | |
| Previous Owner | Lentz Walter A | $260,000 |
Source: Public Records
Tax History Compared to Growth
Tax History
| Year | Tax Paid | Tax Assessment Tax Assessment Total Assessment is a certain percentage of the fair market value that is determined by local assessors to be the total taxable value of land and additions on the property. | Land | Improvement |
|---|---|---|---|---|
| 2024 | $10,767 | $92,880 | $24,219 | $68,661 |
| 2023 | $10,457 | $57,000 | $19,531 | $37,469 |
| 2022 | $10,457 | $57,000 | $19,531 | $37,469 |
| 2021 | $10,257 | $56,999 | $19,531 | $37,468 |
| 2020 | $10,333 | $51,968 | $17,187 | $34,781 |
| 2019 | $10,100 | $56,442 | $17,187 | $39,255 |
| 2018 | $9,105 | $56,442 | $17,187 | $39,255 |
| 2017 | $9,749 | $51,363 | $14,062 | $37,301 |
| 2016 | $9,787 | $51,363 | $14,062 | $37,301 |
| 2015 | $8,931 | $51,363 | $14,062 | $37,301 |
| 2014 | $6,554 | $37,890 | $10,546 | $27,344 |
| 2013 | $6,413 | $37,890 | $10,546 | $27,344 |
Source: Public Records
Map
Nearby Homes
- 2209 N Seminary Ave
- 2116 N Seminary Ave Unit 28
- 2127 N Racine Ave Unit 2
- 2026 N Kenmore Ave
- 1242 W Dickens Ave
- 2235 N Lakewood Ave Unit FN
- 907 W Webster Ave
- 2144 N Fremont St
- 1962 N Bissell St
- 2435 N Clybourn Ave Unit 4S
- 2435 N Clybourn Ave Unit 2S
- 2435 N Clybourn Ave Unit 4N
- 2435 N Clybourn Ave Unit 2N
- 2435 N Clybourn Ave Unit 3S
- 2435 N Clybourn Ave Unit 3N
- 1014 W Montana St
- 1728 N Clybourn Ave
- 908 W Fullerton Ave Unit 1
- 908 W Fullerton Ave Unit PH
- 908 W Fullerton Ave Unit 2
- 1109 W Webster Ave Unit 2
- 1105 W Webster Ave
- 1111 W Webster Ave
- 1111 W Webster Ave Unit 2
- 1111 W Webster Ave Unit 3
- 1103 W Webster Ave
- 1103 W Webster Ave
- 1113 W Webster Ave
- 1113 W Webster Ave
- 1113 W Webster Ave Unit 3
- 1113 W Webster Ave Unit 2
- 1115 W Webster Ave
- 1101 W Webster Ave
- 2142 N Seminary Ave Unit 1
- 1119 W Webster Ave Unit 2E
- 1119 W Webster Ave
- 1119 W Webster Ave
- 1123 W Webster Ave
- 1123 W Webster Ave Unit 2R
- 1123 W Webster Ave Unit 3F